Fish Biomass Calculator
Estimate fish biomass from population count, average length and weight, species group, water volume, survey method, condition factor, survival, and measurement uncertainty.
📌Aquaculture and survey presets
⚙Fish biomass inputs
Use the best current count after grading or survey expansion.
Higher measured sample sizes narrow the confidence range.
Fulton K = 100 x weight g / length cm³.
Leave as 0 to calculate volume from surface area and average depth.
Fish biomass estimate
Full breakdown
📋Species and survey comparison grid
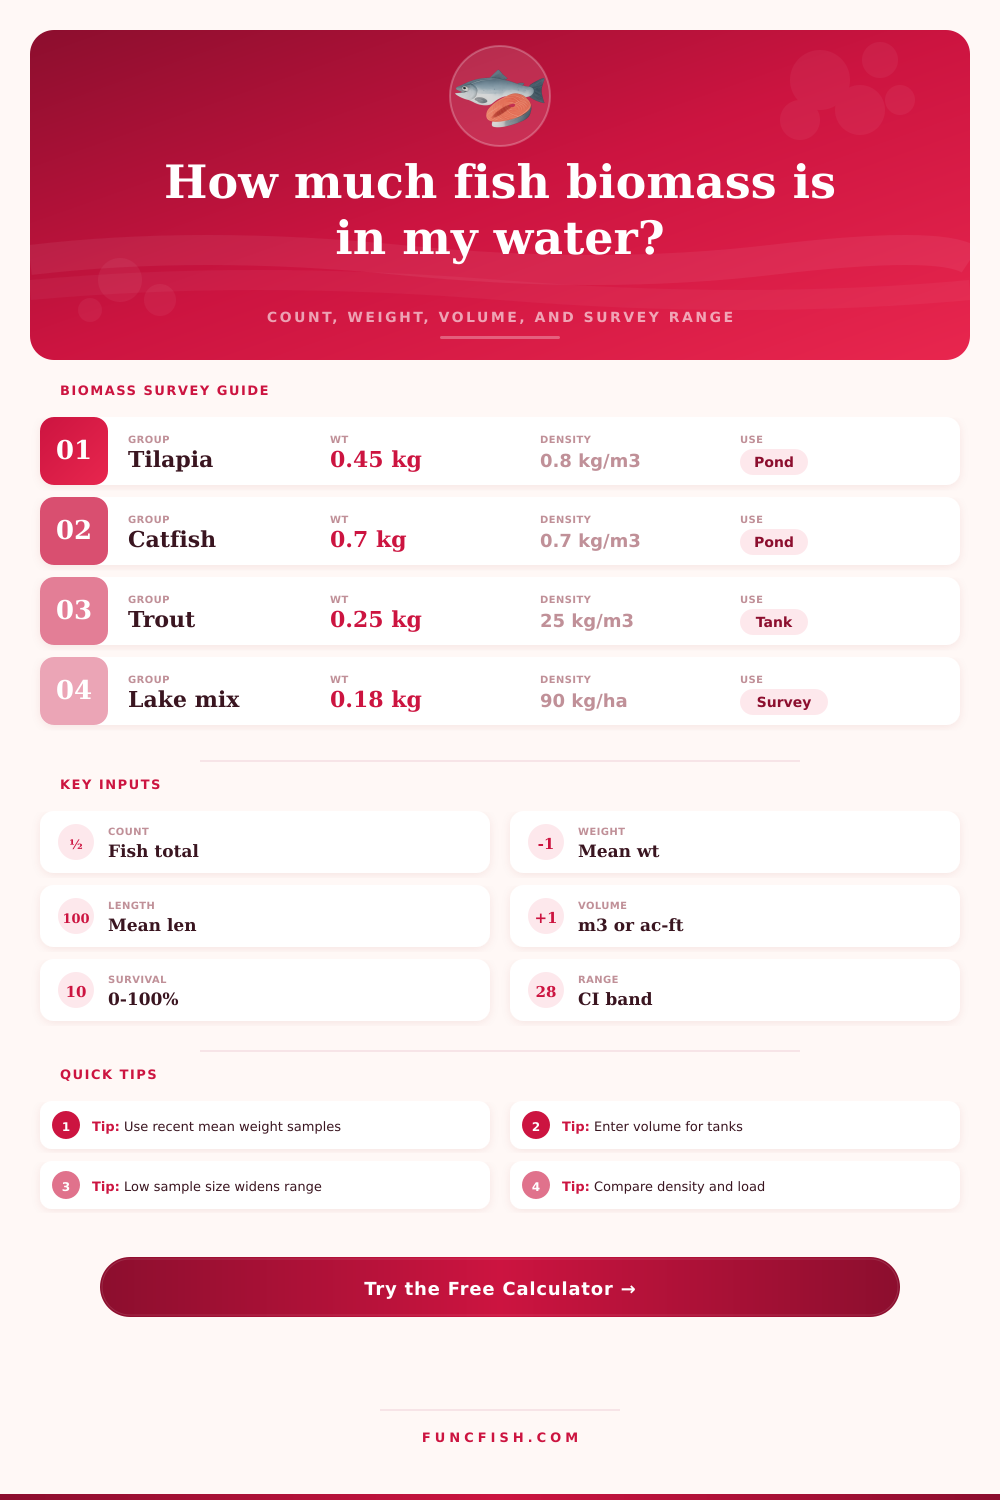
Tilapia Pond
Catfish Unit
Trout Tank
Lake Survey
📊Reference tables
| Species group | Typical mean weight | Pond or lake reference | Tank or cage reference |
|---|---|---|---|
| Tilapia grow-out | 0.3-0.8 kg | 2500-6000 kg/ha | 8-20 kg/m³ |
| Channel catfish | 0.5-1.2 kg | 1800-5000 kg/ha | 6-14 kg/m³ |
| Carp or polyculture fish | 0.25-1.0 kg | 700-2500 kg/ha | 4-10 kg/m³ |
| Rainbow trout | 0.15-0.5 kg | 150-600 kg/ha | 18-35 kg/m³ |
| Salmon smolt | 0.04-0.18 kg | Not area based | 15-28 kg/m³ |
| Lake mixed fish | 0.05-0.4 kg | 40-180 kg/ha | Survey dependent |
| Sample method | Count role | Base range | Best use |
|---|---|---|---|
| Drain harvest count | Direct inventory | 3-6% | Farm ponds, tanks, and vats |
| Bulk weigh sample | Mean weight anchor | 5-8% | Graded aquaculture lots |
| Seine haul expansion | Partial pond sample | 10-18% | Grow-out pond checks |
| Trap-net survey | Catch-per-unit expansion | 18-32% | Walleye, panfish, lake margins |
| Electrofishing transect | Reach expansion | 20-35% | River or shoreline biomass |
| Hydroacoustic estimate | Water-column estimate | 12-28% | Open lake pelagic biomass |
| Water system | Load basis | Calculator focus | Reference note |
|---|---|---|---|
| Fertilized grow-out pond | kg per hectare | Surface area and depth | Natural productivity plus managed feeding |
| Fed earthen pond | kg per hectare | Population and mean weight | Area load is usually more useful than volume density |
| Lake or reservoir | kg per hectare | Survey expansion | Reference load is intentionally conservative |
| Cage or net pen | kg per m³ | Known cage volume | Volume entry should be used when available |
| Raceway or holding tank | kg per m³ | Known water volume | Flow and monitoring change the load reference |
| Condition factor K | Shape signal | Biomass effect | Calculator use |
|---|---|---|---|
| 0.75-0.95 | Lean or elongated fish | Lower weight at length | Check if mean weight seems high |
| 0.96-1.20 | Common wild fish range | Near reference body form | Useful for lake and river surveys |
| 1.21-1.55 | Deep or farmed body form | Higher weight at length | Common in fed ponds and cages |
| 1.56-2.20 | Very deep-bodied lot | Mean weight check needed | Use measured weight when possible |
🧮Species and gear comparison
Pond Seine
10-18% Good for tilapia, catfish, and carp growth checks when hauls cover representative water.Trap Net
18-32% Useful for walleye and lake margins; species behavior can widen confidence bands.Bulk Weigh
5-8% Best for graded farm lots where sample fish are weighed directly by batch.Hydroacoustic
12-28% Works for open-water schools; species composition still needs sample confirmation.💡Calculation checks
Sampling check: Biomass is only as steady as the mean weight sample. If the lot has mixed sizes, increase the measured sample count or split the estimate by size class.
Volume check: Tanks, cages, and raceways should use known water volume when available. For ponds and lakes, surface-area load is often the clearer reference.
Biomass estimation is the measurement of teh total weight of the fish that are in a specific bodies of water or container. Biomass estimation is necessary to calculate the total weight of the fish in a certain body of water to allow the person to make decisions regarding the fish. For instance, if the pond manager did not calculate the total weight of the fish in a pond, the pond may be overstocked with fish.
Overstocking ponds can lead to decrease in the dissolved oxygen in that pond. Alternatively, if the biomass of a pond was understocked with fish, the fish farmer may lose potential profit from the sale of the fish because there will be insufficient fishes to harvest. The first step in the biomass estimation process is to determine the count of the fish in the water.
How to Estimate Fish Biomass
The count of the fish can be obtained by performing a drain harvest or a seine haul of the fish from the water. It is necessary, however, to determine the average length and the average weight of a sample of the fish in the body of water. These measurement must be taken frequently because the size of the fish change over time.
Additionally, many fish farmers use a measurement known as a Fulton K ratio to determine if the fish in their body of water are lean or plumply. Taking the weight of the fish in grams and dividing by the length of the fish in centimeters cubed calculates the Fulton K ratio. This ratio is used to reconcile length measurements of the fish with the weight of the fish.
Biomass measurements are made in relation to the volume or area of the water in which the fish is contained. For ponds, multiplying the area of the pond by the depth of the pond can calculate the volume of the pond. For tanks or cages, more precise measurement of the volume of water are used.
The density of the fish in tanks and cages is typically higher than the density of fish in ponds. In calculating the biomass of the fish in a body of water, the fish farmer must account for the survival rate. The survival rate of the fish is the percentage of the total fish that remain alive following instances of disease or predation of the fish.
Additionally, an uncertainty band should be included in the biomass estimation to account for inaccuracies in the measurements of the fish. A larger sample size will decrease the uncertainty band in the estimation of the total biomass of the body of water. Multiplying the count of the fish by the mean weight of the fish calculates the total biomass of the fish in a body of water.
The density of the fish in that body ofwater can then be calculated by dividing the total biomass of the fish by the volume or area of the body of water. The density of the fish in the body of water can be compared to a carrying load index for that type of fish. For instance, tilapia ponds may contain four and a half ton of tilapia per hectare, but twenty-five kilogram of trout may live in each cubic meter of tank.
The density of the fish in a body of water should not be too high as the fish may experience a population crash. Different species of fish require different densities within the bodies of water. For instance, tilapia can have higher densities within their ponds than trout within tanks because tilapia has deep bodies.
Carp can also be stocked in ponds, but at lower density because carp compete for the same resources in the pond. Additionally, the density of fish species in the wild is typically low and range in weight to under two hundred kilogram of fish per hectare. Additionally, the type of system in which the fish are contained will have an impact on the density of fish that can live in those systems.
For instance, fertilized ponds will have lower densities of fish than areas like raceways where fresh water continuous flows through the system. In calculating the biomass of a population of fish, mistakes can be made if old data is used. For instance, the weights of the fish will change every week that the fish are growing.
Additionally, the survival rate of the fish may change without the fish farmer knowing. If the fish farmer uses old measurements of the fish for weight, the biomass can be overestimate by a significant percentage. Additionally, if the volume of the body of water is calculated inaccurately, then the density of fish in that body of water will also be calculated inaccurately.
To avoid these types of mistakes, fresh measurements of the fish should be made and the Fulton K ratio could be used to ensure that the weights of the fish are similar to the lengths of the fish. Following these step will ensure that the biomass of the fish in a body of water is accurately calculated and that the environment in which the fish live remains stable. You should of checked the data more carefuly.