Fish Survival Rate Calculator
Estimate cohort survival, losses, daily survival, and risk tier from pond, hatchery, stocking, acclimation, or transport observations.
This tool is for planning and recordkeeping. It estimates survival patterns from counts and environmental context; it does not diagnose fish health or replace site-specific testing.
| Scenario | Baseline Range | Main Stress Driver | Count Window |
|---|---|---|---|
| Indoor hatchery nursery | 92-99% | Feed transition and tank density | Daily to weekly |
| Earthen pond stocking | 85-97% | Predation, oxygen dip, water shift | 3-14 days |
| Raceway or flow-through tank | 90-98% | Flow interruption or crowding | 1-7 days |
| Cage transfer | 86-96% | Net abrasion and crowding | 1-10 days |
| Bag acclimation | 80-95% | Temperature and chemistry shift | 1-7 days |
| Short truck transport | 88-97% | Loading and unloading stress | 0-3 days |
| Long truck transport | 76-94% | Time, density, oxygen reserve | 0-7 days |
| Post-grading recovery | 82-96% | Sorting pressure and abrasion | 1-5 days |
| Band | Warmwater | Coolwater | Planning Note |
|---|---|---|---|
| Cool stable | 60-72 F | 46-58 F | Often the easiest transfer window |
| Target range | 72-82 F | 50-64 F | Use normal handling assumptions |
| Warm caution | 83-88 F | 65-70 F | Extra aeration and shorter handling |
| High stress | 89 F plus | 71 F plus | Expect survival range to narrow |
| Low oxygen event | Any temp | Any temp | Track survival separately from stocking loss |
| Handling Method | Adjustment | Best Fit | Watch Item |
|---|---|---|---|
| Water-to-water transfer | Best | Small fish and fry | Count accuracy |
| Soft knotless net | Good | Fingerlings and mixed ponds | Net loading |
| Crowded dip net | Moderate | Short moves only | Abrasion and oxygen |
| Mechanical grading | Moderate-high | Uniform batches | Post-sort holding time |
| Dry surface exposure | High | Avoid when possible | Time out of water |
| Confidence | Typical Source | Band Used | Interpretation |
|---|---|---|---|
| High | Full hand or machine count | +/- 1.5% | Good for batch comparison |
| Medium | Representative sample count | +/- 3% | Useful for routine checks |
| Low | Partial seine or tank estimate | +/- 6% | Flag trends, not exact loss |
| Very low | Visual estimate in turbid water | +/- 10% | Use as a warning signal only |
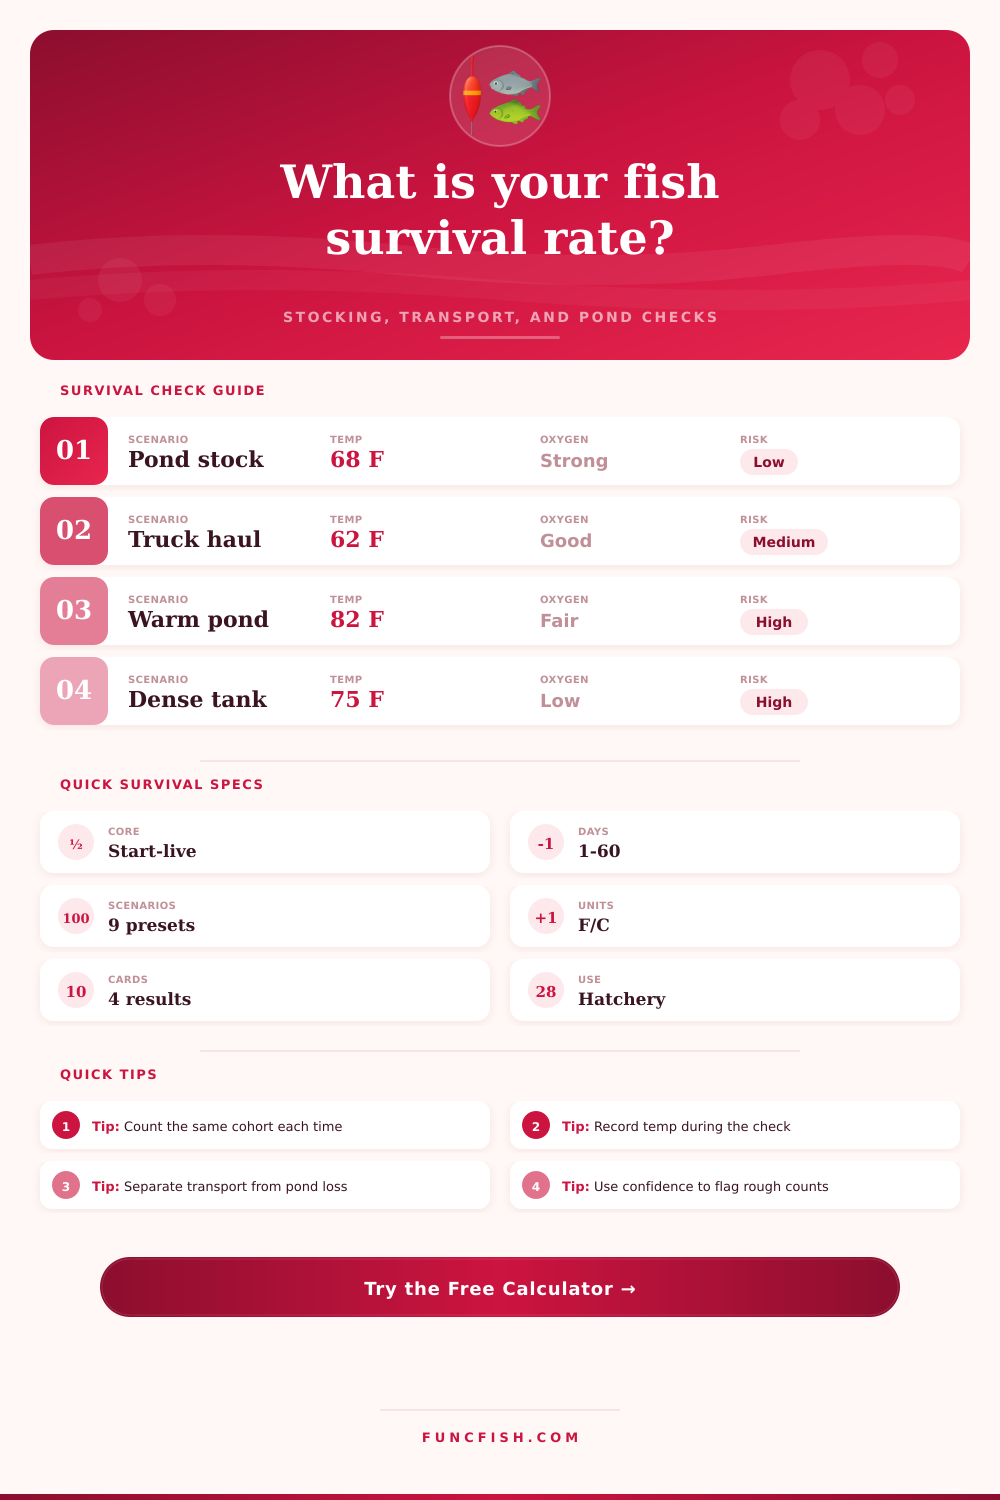
Use the fish survival rate calculator to compare starting and live counts with stocking context, temperature, oxygen stress, handling, and observation confidence for clearer pond or hatchery records.
Survival rates in fish culture refers to the number of fish that survive within a specific group of fish. Survival rate are important to farmers in that they indicate whether the stocking process of fish into ponds was successful or whether environmental stressors were negatively impacting the survival of the stock fish. In order to understand the survival rates within a group of fish, it is important to track the survival rates of that group over time, as this will enable fish farmers to identify patterns in the mortality of the fish in that group.
Many factors can contribute to fish mortality within a pond. Some of those factors includes changes in the water temperature within the pond, low levels of oxygen within the water, the way in which farmers handle the fish (especially with improper equipment), and the possibility of other animals within the pond that may be eating the fish. For instance, if fish are move from one location to another using a net, the abrasions of the nets edges can damage the skin of the fish.
How to Count and Keep Fish Alive
Because damaged skin places additional stress upon the fish, soft knotless net should be used when moving fish from one location to another to reduce such stress upon the fish. Additionally, the species of fish that are stocked into the ponds may have different requirement for there survival. For instance, species like tilapia and catfish is considered to be hardy fish species, and can survive in water temperatures of the seventies and eighties on the temperature scale.
Trout are not as hardy than species like tilapia, however, and require water temperatures of the fifties and sixties to ensure high survival rates of their species. Finally, shrimp are sensitive to changes in the salinity of the water in which they lives and the dissolved oxygen levels in that same water. Thus, changes to those water parameter will have an immediate impact upon the survival rates of shrimp.
In order to calculate survival rates of the fish within a pond, there are certain data elements that fish farmers should record. For instance, the farmer should record the water temperature within the pond during each check of the survival rates of the fish within the pond. Additionally, instances of low level of oxygen within the water should be separated from instances of mortality after the fish are stock into the pond.
Furthermore, twelve hours should be allowed to pass between the time that farmers handle the fish and the time that their survival is counted, to allow the stress upon the fish to subside. Many people make mistake when counting the survival of fish. For instance, the mortality of fish that died during transportation should be separated from those that die after they are stock into the pond.
Additionally, each individual survival rate calculation should use the same definition for the group of fish being evaluate, as different definition will lead to inconsistent survival rate calculations. A risk tier can be used to evaluate the threat level of the survival rates of the fish within a pond. A risk tier of low indicates that the batches of fish is stable and surviving, but a risk tier of critical indicates that the survival rates are dropping in comparison to the expectations of their survival rates.
A risk tier of moderate indicates that the survival rates should be evaluated again, but a risk tier of high indicates that the farm operations should be reviewed to determine the cause of those determine risk factors. Finally, another important management practice regarding fish farms is the monitoring of various environmental factors within the ponds. Such factors include the dissolved oxygen levels within the pond, the feeding record of the fish within the pond, and the weather pattern surrounding the fish farm.
For instance, if weather patterns that lead to water temperatures of eighty-three to eighty-eight degrees Fahrenheit expose the warmwater fish species being raised by the farmer, the aeration levels for the pond should be increased to ensure that the oxygen levels of the water are able to sustain the survival of the fish during those warm weather period. Through the consistent monitoring and recording of these various environmental factors, fish farmers will be able to maintain high survival rates of their stocked fish.