Fish Mortality Rate Calculator
Calculate observed mortality, compound daily mortality, annualized equivalent or event rate, alert tier, and confidence range for aquaculture lots, holding systems, and field samples.
📌Fishery and aquaculture presets
⚙Mortality inputs
Use the count at the start of the mortality window.
Enter removed or observed dead fish for the same window.
Set 100 for full inventory; use lower coverage for expanded samples.
Mortality rate results
Calculation breakdown
📊Condition reference cards
Rate basis
Count quality
Environment
Adjustment
🧭Comparison grid
Routine pond benchmark
2.5x versus 0.02% daily watch lineHandling event benchmark
0.2x versus 2% event alert lineAnnualized survival
83.3% compound equivalent at current daily rateUncertainty width
0.20% confidence band around observed rate📚Reference tables
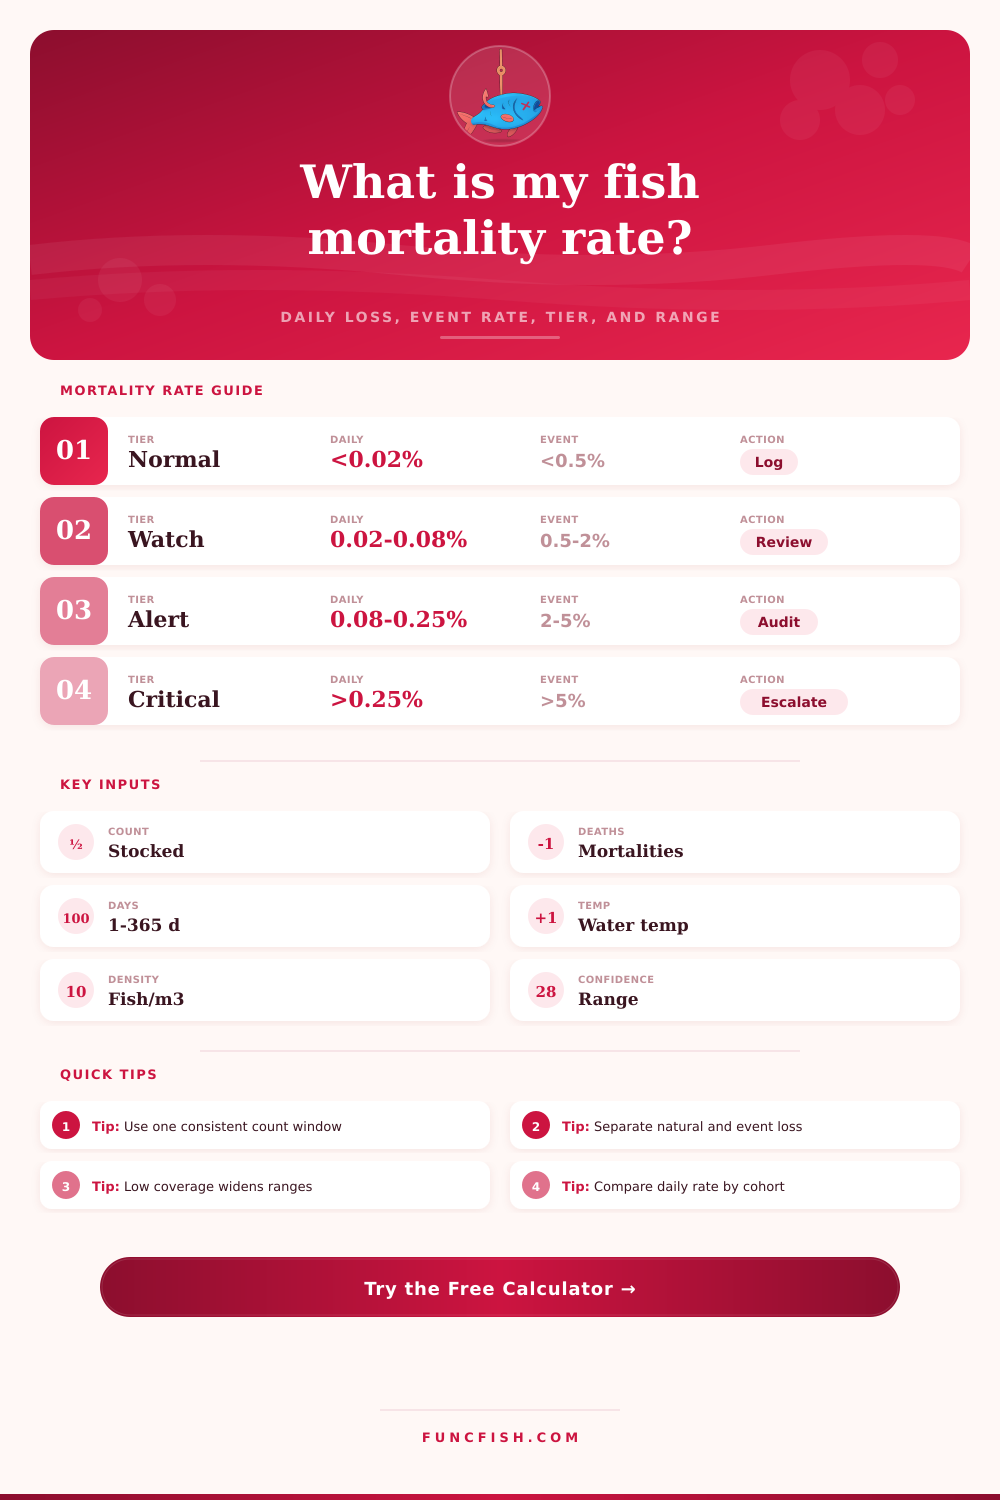
| Alert tier | Routine daily mortality | Event mortality | Interpretation |
|---|---|---|---|
| Normal | Less than 0.02% per day | Less than 0.5% of exposed fish | Within a low background accounting band |
| Watch | 0.02% to 0.08% per day | 0.5% to 2% of exposed fish | Track by lot, date, and count method |
| Alert | 0.08% to 0.25% per day | 2% to 5% of exposed fish | Review system records and counting assumptions |
| Critical | More than 0.25% per day | More than 5% of exposed fish | Escalate operational review and documentation |
| Scenario | Default coverage | Alert multiplier | Best use |
|---|---|---|---|
| Full inventory or harvest count | 90% to 100% | 1.00 | Lots with counted removals and known start count |
| Daily tank or cage census | 70% to 95% | 1.08 | Routine production log comparisons |
| Partial seine or dip-net sample | 10% to 40% | 1.25 | Expanded pond or nursery estimates |
| Handling or grading subsample | 30% to 70% | 1.35 | Short windows after netting or size grading |
| Transport or transfer exposure | 50% to 100% | 1.50 | Event loss during moves, stocking, or transfer |
| Wild fishery survey reach | 5% to 30% | 1.40 | Reach-level field sample comparisons |
| Water temperature band | Calculator temp index | Typical interpretation | Notes for comparison |
|---|---|---|---|
| Less than 8°C / 46°F | 1.10 | Cold-water accounting band | Short feeding or handling windows may skew counts |
| 8°C to 16°C / 46°F to 61°F | 1.00 | Cool-water baseline band | Useful for trout, salmonids, and cool surveys |
| 16°C to 28°C / 61°F to 82°F | 1.00 | General production baseline band | Works for many warmwater pond comparisons |
| 28°C to 32°C / 82°F to 90°F | 1.20 | Warm monitoring band | Compare lots using the same temperature window |
| More than 32°C / 90°F | 1.45 | High-temperature alert band | Use shorter windows when rates change quickly |
| Density context | Approx fish/m³ | Index effect | Where it fits |
|---|---|---|---|
| Low pond or survey density | Less than 5 | Low pressure | Extensive ponds, lakes, and field samples |
| Moderate pond or cage density | 5 to 25 | Baseline | Common grow-out tracking |
| High tank or raceway density | 25 to 75 | Elevated | Intensive juvenile or raceway lots |
| Very high holding density | More than 75 | High alert weight | Short-term holding and event comparisons |
💡Calculation notes
Window discipline: Compare cohorts with the same start-count rule, mortality collection rule, and day length. Mixing a seven-day routine log with a two-hour event can hide the signal.
Sampling discipline: Partial samples need wider confidence bands. Use the coverage field to show how much of the lot or reach the mortality count represents.
Fish mortality refer to the death of fish within an aquaculture system. Monitoring fish mortality within a farm are necessary because fish mortality directly impact the total yield and total profit that a fish farm can earns. If fish die within the pond or near an aerator, that means the farm has lost some of it stock.
Additionally, if the fish farm experience high rates of fish mortality, the total number of fish that can be harvest from the farm will decrease, which will impact the margin that the farm can earn. Many instance of fish mortality are small and occur each day within the farm. However, these small losses each day can lead to a more significant loss in the total yield that the farm can obtain each season.
Measuring and Managing Fish Deaths on a Fish Farm
Fish mortality can be manage by distinguishing between two types of mortality: background loss and event loss. Background loss is the mortality that occur regularly within the farm, even under ideal conditions. However, event loss is the mortality that occurs due to specific event within the farm.
These events may include storms, changes in water temperature within the pond, and the handling of fish during the grading process. Additionally, if the stocking density within the farm are high, this can also lead to increased mortality due to the stress that the fish experience and the increased possibility of the spread of disease within the farm. Fish mortality can also be measure by daily mortality rates.
This require calculating the number of deaths within the system each day. The compound daily mortality rate should be used rather than the simple division of the total number of deaths divided by the number of day. This is because the mortality of fish build upon the number of surviving fish.
Therefore, if using the simple division method, there may be overstatement of the mortality rate during periods with few fish death and understatements during periods of high mortality rates. Events require a different method of measurement than the daily mortality rates. For instance, during storms or during the grading of fingerlings, it is necessary to calculate the percentage of the total loss of fish that occur during these events.
Additionally, another consideration when calculating the mortality of fish within a pond is the coverage of the sampling of fish within that system. The smaller the sample size, the higher the uncertainty of the mortality rate. A higher degree of confidence can be provide in the mortality rate of a farm with a higher count of fish and with full coverage of the fish within the system.
Alert tiers can be used to categorize the mortality within a farm into different level of urgency. For example, mortality within a farm can be classified as normal, requiring a review, or requiring an audit. If the mortality within a farm are below a specific threshold, it is considered to be within normal limits.
If the mortality or the stressors within the environment increase, it move to the watch level. These stressors may include high water temperatures or high stocking densities within the farm. If the temperature of the water are above 28 degrees Celsius or if the stocking densities of fish is above 75 fish per cubic meter, then the stressor within the farm increase.
Finally, if the mortality continues to increase to indicate a crisis in the farm, it reach a critical level for that farm. Common error in measuring mortality include mixing the mortality rates of different time spans. For example, it would be an error to calculate the mortality rate of a seven-day span and mix it with a two-hour calculation of mortality during transport of fish to another location.
In addition to this, ignoring the issue of coverage in sampling can lead to uncertainty in the mortality rate. The same is true for the overlooking of the importance of water temperature. Finally, when determining the mortality rate of different fish lot, the same rules for starting counts and removal logs should be followed.
Fish mortality should be track according to the age of the fish within each farm lot and the source of the fish. Additionally, the farm should log the handling of the fish within each farm, as well. Depending upon the handling of the fish, the mortality rate will increase.
For instance, light netting of fish may lead to a small increase in the mortality rate of the group of fish; however, moderate grading may have a greater impact on the mortality rate of that group of fish. By logging these variable, the fish farmer can determine whether the mortality of fish within the farm is due to water quality issue or pathogenic issues. Using these different category, logs, and method for calculating the mortality of fish, it is possible to quantify the mortality of fish within each farm into different tier and range of loss.
By creating these categories, it is also possible to take action to limit the mortality of fish before it lead to a more significant loss of the total yield of fish that the farm can obtain season after season.