Back-Calculated Length at Age Calculator
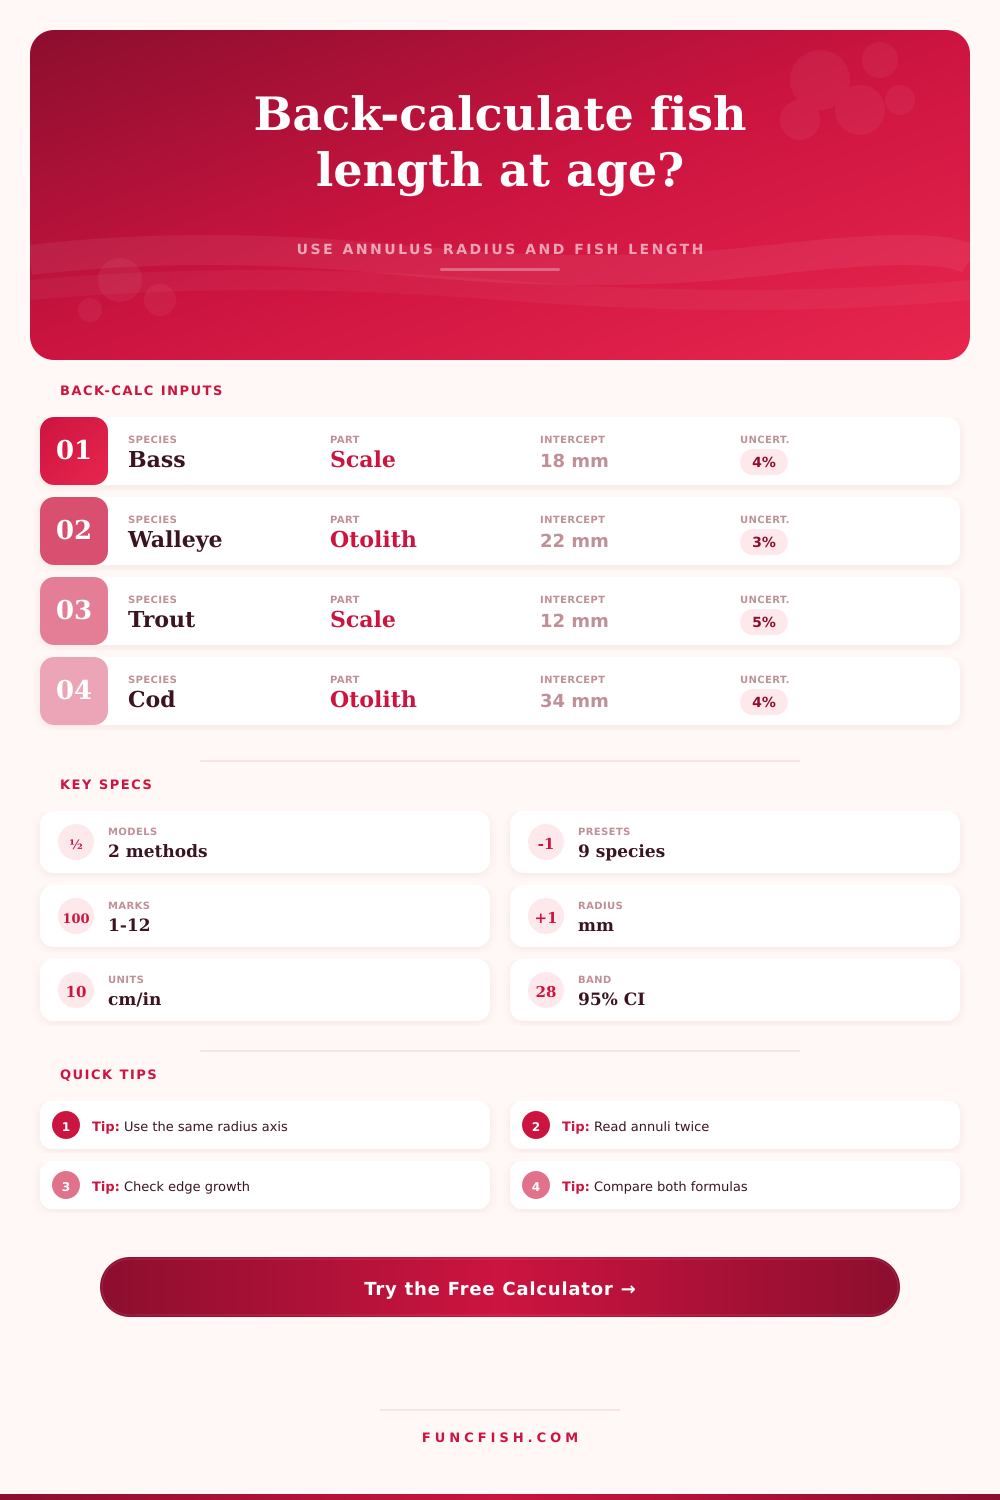
Estimate earlier fish length from annulus radius, present length, body-structure relation, biological intercept, and measurement uncertainty.
📌Species and structure presets
⚙Back-calculation inputs
Back-calculated growth estimate
Formula breakdown
📊Species comparison grid
Largemouth Bass
Walleye
Rainbow Trout
Atlantic Cod
📋Back-calculation reference tables
| Species preset | Structure | Typical intercept | Typical slope | Best model check |
|---|---|---|---|---|
| Largemouth bass | Scale radius | 1.8 cm | 5.6 cm/mm | Fraser-Lee for nonzero hatch size |
| Walleye | Otolith radius | 2.2 cm | 7.4 cm/mm | Compare both methods |
| Rainbow trout | Scale radius | 1.2 cm | 4.9 cm/mm | Check regenerated scales |
| Atlantic cod | Otolith radius | 3.4 cm | 9.8 cm/mm | Otolith cross-check preferred |
| Channel catfish | Pectoral spine radius | 2.8 cm | 8.2 cm/mm | Watch early annulus crowding |
| Bluegill | Scale radius | 0.9 cm | 3.6 cm/mm | Use consistent anterior field |
| Northern pike | Cleithrum radius | 2.6 cm | 10.5 cm/mm | Large intercept sensitivity |
| Yellow perch | Scale radius | 1.0 cm | 4.2 cm/mm | Good for young fish |
| Red drum | Otolith radius | 2.5 cm | 8.9 cm/mm | Otolith margin matters |
| Formula | Equation | What it assumes | When to inspect |
|---|---|---|---|
| Dahl-Lea | Li = Lc x Ri / Rc | Body length and structure radius pass through zero | Use as a proportional baseline |
| Fraser-Lee | Li = a + (Lc - a) x Ri / Rc | A biological intercept corrects early growth | Useful when fry length is not zero |
| Relation check | Li = a + b x Ri | Species relation slope is locally appropriate | Compare against sample-derived slope |
| Edge-adjusted ratio | Ri / (Rc - edge) | Unmarked marginal growth may bias radius ratio | Use when edge increment is large |
| Structure type | Measurement axis | Common strength | Common caution |
|---|---|---|---|
| Scale | Focus to anterior margin | Fast processing and many samples | Regeneration and resorption can bias old fish |
| Otolith | Core to annulus on section | Good permanent archive of growth | Needs careful section plane |
| Spine | Center to annular ring | Useful for catfish and sturgeon work | Early rings may erode |
| Cleithrum | Focus to annular mark | Useful in large esocids | Preparation differences matter |
| Quality flag | Radius uncertainty | Reader disagreement | Interpretation |
|---|---|---|---|
| High | 1-3% | 0 marks | Narrow band, strong annulus placement |
| Moderate | 3-6% | 0-1 mark | Report interval and model spread |
| Low | 6-10% | 1 mark | Treat length at age as approximate |
| Review | 10%+ | 2 marks | Re-read structure before summary use |
💡Back-calculation checks
Tip: Keep the annulus radius and total radius on the same measurement axis. A mixed axis can look precise but distort every age estimate.
Tip: When Fraser-Lee and Dahl-Lea differ strongly, report both and inspect whether the intercept was derived from the same stock and structure type.
When you look at a grown fish, all you see is end result. It is a six-pound walleye or a 40-cm bass. What you don’t see is story about how they got there.
Maybe they grew steadily and quick. Or maybe they spent three years stuck on a muddy bottom before a brief feeding frenzy bumped them up to trophy status.
How Fish Grow and How We Measure It
Length at age let you go back and rewind that biological clock. It takes one static measurement and converts it into a growth history… The hidden conditions of its early life.
By understanding the logic behind math, you can distinguish between a reliable estimate and just a guess. But how do they make it all work?
It’s just a matter of matching size of those growth structures with the size of fish. Otoliths form layers as the fish grow. So does the size of the fish’s scales.
For each ring, there is a distance from its center to its outer edge. Therefore, if we has an understanding of total radius of that structure, and the present length of fish, we can estimate the length of the fish at the time that annulus formed.
Essentially the tool measures the partial radius against the total radius, accounting for the fact the fish didn’t begin life at zero length. The intercept handles this. And the intercept are the most critical variable in the whole equation.
The second element is selecting an apropiate intercept for your particular growth model. To do so, you must know what growth model best describes your data.
For example, with the Dahl-Lea method, the assumption is there was a straight line from the origin, meaning both the fish and its structure began at zero. This is rarely true in reality. Fish is typically born of some measurable size. Their structures also already contain a core.
The biological intercept added to the Fraser-Lee method accounts for starting point discrepancy. And it matters.
In fact, if you don’t account for the intercept, a large largemouth bass that is already quite long will result in all those back-calculated lengths being too low for the first couple of years. It is a small detail, but it is important enough to help us select a coefficient that matches our stock instead of shooting blindly into the dark.
This is why the page include a reference table of typical intercept values for various species. Everything else in the workflow depends on what structure you measured.
If it’s scales, those are easy to obtain and work with but they also can be regrown if your fish has been handled hard or caught in a net. Regenerated scales frequently have ring distortion compared to real rings, so they don’t show the true growth history.
Otoliths provide more permanent, denser structures, making record of early life clearer. However, care must be taken when reading them because they need to be sectioned.
For certain fish such as pike or catfish, alternative structures exist such as spines and cleithra which may give more consistent readings different than scales. The calculator prompts you to choose the structure you’re taking measurements of because each structure type has its own slope relationship with body length.
This means that a slope calculated based off scales won’t work for correcting otolith measurements and vice versa. Only one rule applies: consistency.
That’s right: the biology has features, one of which is uncertainty. The data don’t have bugs; they have uncertainty. There is no perfect measurement, and no reader are infallible.
By entering both uncertainty in your measurements and variance among readers (e.g., by measuring multiple times or having multiple people read an otolith), the tool creates a confidence interval instead of just a single number as its final output. That’s the band representing amount of confidence to put in the estimate.
A wider interval meant the annuli were messier or the edge growth was less clear. It’s honest accounting for the messiness of field data, and you should of always report a range rather than falsely precise numbers.
Think of this back calculation like detective work. You’re trying to recreate a long-past existence by analyzing the physical evidence found within the scale or bone.
The math provides the framework, and judgment fills in the details. Your measurements need to be verified on a second read. Your guesses regarding the intercept should be checked.
Remember: each ring represents a story of environmental stress and available food. Your formula doesn’t give a crap about the fish; you need to respect the fish’s reality to get an accurate answer.