Predator Prey Balance Index Calculator
Score fishery balance from predator biomass, prey biomass, predator CPUE, prey CPUE, forage size overlap, recruitment signal, habitat cover, and seasonal temperature.
📌Fishery balance presets
⚙Balance inputs
Predator-prey balance readout
Full breakdown
🐟Species and trophic balance grid
Bass-Bluegill
Walleye-Shad
Pike-Perch
Trout-Minnow
Striper-Herring
Catfish-Shad
Muskie-Cisco
Redfish-Mullet
📘Biomass ratio reference
| Balance lane | Predator share of fish biomass | Prey to predator biomass | Likely interpretation |
|---|---|---|---|
| Predator thin | Under 12% | Over 9:1 | Forage may be under-used, adult prey can crowd, predator recruitment may be weak. |
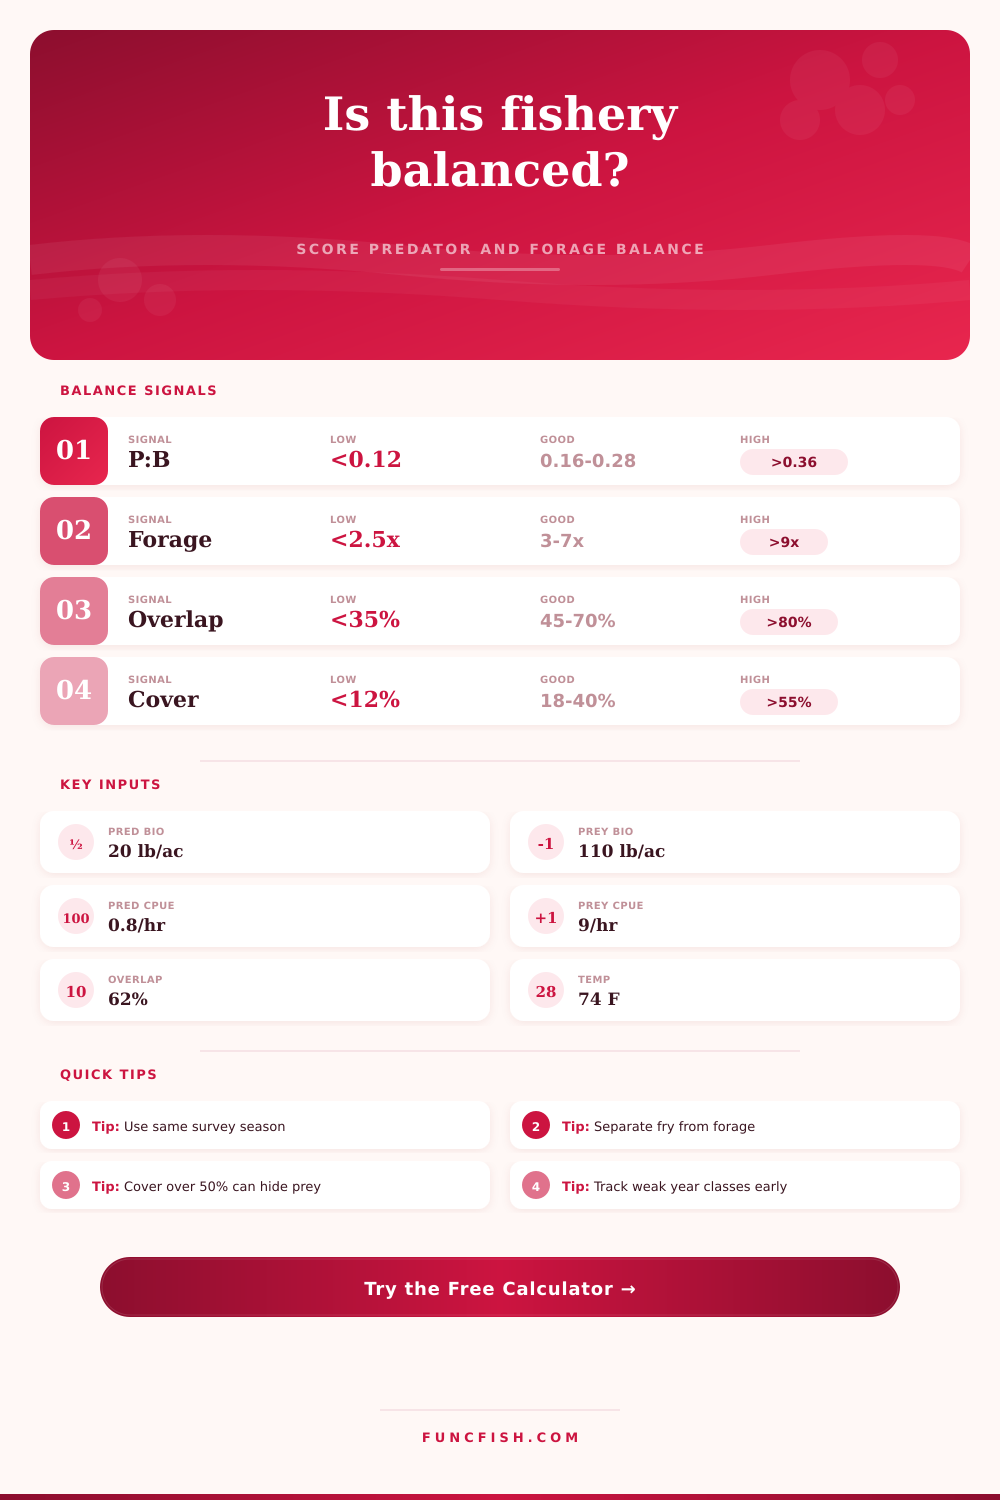
| Balanced | 16-28% | 3.5:1 to 7:1 | Predators have enough food while still applying useful size control. |
| Tight forage | 28-36% | 2.5:1 to 3.5:1 | Growth can slow if overlap and warm temperature raise feeding demand. |
| Predator heavy | Over 36% | Under 2.5:1 | Forage replacement must be strong or predator condition usually declines. |
📊CPUE and overlap reference
| Field signal | Low concern | Watch zone | High concern |
|---|---|---|---|
| Predator CPUE relative to prey CPUE | Under 0.08 | 0.08-0.22 | Over 0.22 |
| Forage size overlap | 35-55% | 55-75% | Over 75% with low prey biomass |
| Recruitment signal | 60-100 | 40-59 | Under 40 or missing young prey |
| Season temperature stress | Near guild optimum | 5-10 F outside optimum | Over 10 F outside optimum |
🌿Habitat cover reference
| Cover band | Percent cover | Predator-prey effect | Calculator treatment |
|---|---|---|---|
| Sparse | 0-12% | Few nursery edges; young forage has little refuge. | Reduces recruitment support and raises vulnerability. |
| Useful edge | 12-25% | Predators can hunt edges while prey still has escape cover. | Small positive balance modifier. |
| Balanced cover | 25-40% | Good juvenile survival without fully shielding prey. | Strongest habitat score for mixed sport fisheries. |
| Dense refuge | 40-60% | Prey survival rises but predator access and growth may fall. | Credits recruitment but penalizes hunting efficiency. |
| Choked | Over 60% | Can hide forage, compress oxygen, and produce size imbalance. | Raises imbalance risk even when prey CPUE is high. |
🌡Seasonal temperature guide
| Predator guild | Cool edge | Preferred window | Warm stress signal |
|---|---|---|---|
| Black bass | Under 60 F | 68-82 F | Over 86 F can raise demand and handling stress. |
| Walleye / sauger | Under 48 F | 55-72 F | Over 76 F often shifts feeding depth and prey access. |
| Pike / muskie | Under 45 F | 50-68 F | Over 74 F can reduce growth efficiency. |
| Trout / char | Under 40 F | 45-62 F | Over 68 F signals thermal squeeze risk. |
| Catfish | Under 58 F | 70-86 F | Over 90 F raises oxygen and forage stress concerns. |
| Redfish / drum | Under 55 F | 68-84 F | Over 88 F can compress feeding windows. |
💡Calculation tips
Tip: Keep the survey method consistent. A seine-based prey CPUE and an electrofishing predator CPUE can still be useful, but compare each to its own prior trend.
Tip: Run separate presets for spring, summer, and fall when water temperature or forage size changes quickly. Balance can look good in spring and tight by late summer.
The size of your fish in the livewell determine success for most anglers, but that doesn’t say anything about health of the water. You can have a lake full of giant bass, but quietly starve its forage population. Or you could have a lake choked with little stunted panfish because there’s just not enough food to go around and too many mouths. Balance typically determines whether it’s a trophy water or a stagnant one, and it’s never typicaly luck.
And that’s what the tool does, it takes into account environmental stressors, catch rates and biomass ratios then runs the math out for you (the calculator is up top). Because if you view a number on its own, raw, it lies to you. Great catch per unit effort among predator? Cool…until you find the system is crashing because the forage biomass has collapsed. The tool makes you consider relationship between the hunter and the hunted, not just the hunter. You have to see the whole picture.
How to Keep Your Lake Balanced
First, start at the bottom: biomass inputs. How many predators versus available forage? Is it predator thin (less than twelve percent of total fish biomass made of predators)? Then adult forage dominates the ecosystem. There aren’t enough left to impact predator recruitment. Also, forage isn’t being used very wellly. At the other end, more than thirty-six percent of the biomass are predators. That is a dangerously thin buffer of food. Condition go down and growth slows. Those numbers gets weighed pretty heavily in the calculator because that’s the physics of the lake, energy transfer.
The changing part of the equation is the pressure in terms of both vulnerability and catch rates; whereas the biomass is simply static part of the picture. This is why size overlap and CPUE (catch per unit effort) inputs is so important. Intense pressure equals a high predator catch rate compared to the prey catch rate. Apply that pressure to a prey base where much of the food are in the vulnerable size window. This creates a recipe for tight forage conditions. There’s an abundance of hungry predators and they can all easily catches some food… The system tightens up fast.
The buffer is habitat cover. Not only does cover make fish accessible to anglers, it’s the buffer that keeps prey alive long enough to reach a non-vulnerable size class. In the reference tables on page, you’ll notice balanced cover will typically range from twenty-five to forty percent. Below twenty-five percent, there isn’t much refuge for young forage and they don’t lasts long enough to impact biomass. More than sixty percent and the water may get too choked. Either prey are hidden so well that predators starve while surrounded by them, or oxygen problems limits the available water column. It is a small thing, but it matter.
Metabolism drives demand. Temperature is the invisible hand. A bass at eighty degrees Fahrenheit need significantly more food than a bass at sixty-eight. The calculator accounts for that thermal stress on fish. When there is high forage overlap and hot water, the predation load spike. Predators consume faster then prey populations can reproduce, and it’s often a population crash followed by a long recovery.
Balance is seasonal… Don’t attempt to run a fishery based off a single snapshot in time. Spring may appear ideal, with mild temps and strong recruitment. However, late-summer conditions could of reverse from balanced to predator-heavy due to depleted forage and higher temps. Run the seasonally preset indexes to observe the shift and look for warning signs early. A drop in the recruitment signal to less than forty indicate you’re missing the young prey. This is not an issue for next year, but it is an issue for three years from now.
Focus on resilience, not perfection. Balanced systems absorbs shocks and rebound from bad spawning years and warm spells. Imbalance make a system brittle. A good spawning year or one warm summer tip it over the edge. Find your lane with the tool and hold the predator amount in the 16-28 percent range of biomass. Hold the forage buffer in the three-to-seven-to-one ratio of prey to predators.
This makes us no longer chase fish, but manage an environment that yields them. No longer do we view the lake as a series of separate species, but as one interconnected system. The calculator does all of the conversions and coefficients for you, but your responsibility is supplying it with the real deal. Feed it the truth and the balance index will show you where pressure’s mounting. Listen up before the livewell empties.