🐟 Fish Fulton Condition Factor Calculator
Assess fish health & body condition using the Fulton K Factor formula — works for any species in metric or imperial units
| Species | Poor K (< value) | Average K | Good K | Excellent K (> value) | Typical Habitat |
|---|---|---|---|---|---|
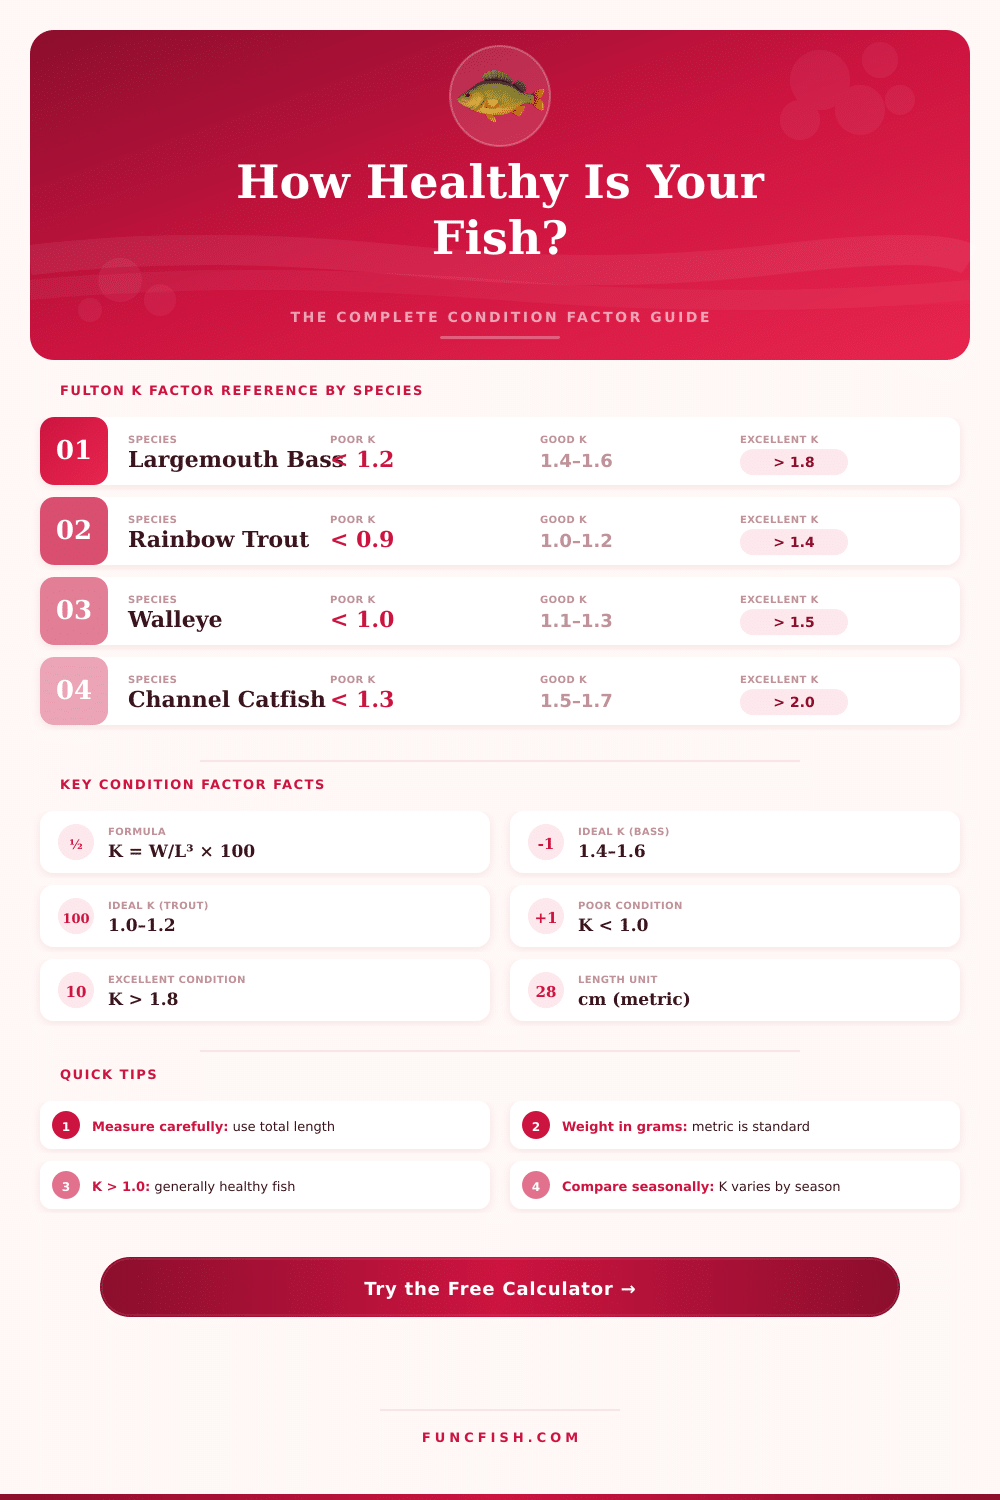
| Largemouth Bass | < 1.2 | 1.3 | 1.4–1.6 | > 1.8 | Lakes, Ponds |
| Smallmouth Bass | < 1.1 | 1.2 | 1.3–1.5 | > 1.7 | Rivers, Lakes |
| Rainbow Trout | < 0.9 | 1.0 | 1.0–1.2 | > 1.4 | Cold Streams |
| Brown Trout | < 0.9 | 1.0 | 1.0–1.3 | > 1.5 | Cold Streams |
| Walleye | < 1.0 | 1.1 | 1.1–1.3 | > 1.5 | Lakes, Rivers |
| Channel Catfish | < 1.3 | 1.5 | 1.5–1.7 | > 2.0 | Rivers, Ponds |
| Bluegill | < 1.4 | 1.6 | 1.6–2.0 | > 2.2 | Ponds, Lakes |
| Northern Pike | < 0.7 | 0.8 | 0.8–1.0 | > 1.1 | Lakes, Slow Rivers |
| Black Crappie | < 1.2 | 1.4 | 1.4–1.7 | > 1.9 | Lakes, Reservoirs |
| Striped Bass | < 1.0 | 1.1 | 1.1–1.4 | > 1.6 | Coastal, Reservoirs |
| K Value Range | Condition Rating | Fish Health Assessment | Likely Cause |
|---|---|---|---|
| < 0.80 | Very Poor | Severely underweight | Disease, starvation, overcrowding |
| 0.80 – 0.99 | Poor | Below average weight-for-length | Food scarcity, parasites, stress |
| 1.00 – 1.19 | Fair | Slightly below average | Seasonal variation, spawn recovery |
| 1.20 – 1.39 | Average | Normal body condition | Healthy population dynamics |
| 1.40 – 1.59 | Good | Above average weight-for-length | Good forage availability |
| 1.60 – 1.99 | Excellent | Well-nourished, robust fish | Excellent habitat and food supply |
| ≥ 2.00 | Outstanding | Exceptional body condition | Trophy fishery, high forage density |
| Species | Length (cm) | Expected Weight (g) at K=1.0 | Trophy Weight (g) at K=1.6 | Imp. Length Equiv. |
|---|---|---|---|---|
| Largemouth Bass | 35 | 428 | 685 | 13.8 in |
| Largemouth Bass | 50 | 1,250 | 2,000 | 19.7 in |
| Rainbow Trout | 30 | 270 | 432 | 11.8 in |
| Rainbow Trout | 45 | 911 | 1,458 | 17.7 in |
| Walleye | 50 | 1,250 | 2,000 | 19.7 in |
| Walleye | 65 | 2,746 | 4,394 | 25.6 in |
| Channel Catfish | 55 | 1,664 | 2,662 | 21.7 in |
| Bluegill | 18 | 58 | 94 | 7.1 in |
| Season | Typical K Shift | Reason | Interpretation Note |
|---|---|---|---|
| Spring (Post-Spawn) | −10% to −20% | Energy used for spawning | Lower K is expected, not concerning |
| Summer (Peak) | Baseline | Active feeding, peak metabolism | Best time for accurate K assessment |
| Fall (Pre-Winter) | +5% to +15% | Hyperphagia, fat reserves building | Higher K is expected and healthy |
| Winter | −5% to −10% | Reduced feeding, metabolic slowdown | Compare to other winter samples only |
The Fulton’s condition factor gives a easy estimate of whether fish is healthy or weak because of hunger. One offered it at the start of the 1900s and it bases on a simple formula: K = 100 × weight divided by cube of the length Multiplied by 100, you get a value around 1, that shows average health. Really fat fish reaches higher, for instance 1.2 or even 1.5 for a real cannonball, while slim stay below.
K-factor around 1 show normal state. Higher than 1.2 point to a plump fish, and under 0.8 slim. Weight-length relation and Fulton’s condition factor are main measures in fishing research, closely bound because they first appeared together.
Fulton’s condition factor: a simple way to check fish health
The weight-length relation describes the tie between weight and length for a particular species and help to estimate growth patren.
Here is something interesting. You cite most commonly Fulton (1911) “The Sovereignty of the Sea” for the condition factor, but that is wrong. The book says nothing about fish condition.
It describes history of sea law, including the 3-mile zone around coasts. Actually Heincke defined the “condition factor” in 1908 for nutrition. In 1912 Johnstone followed its evolution and credited it to D’Arcy Thompson and others before Fulton.
The Fulton’s condition factor assume isometric growth, so physical length, height and thickness stay relatively same. To reduce influence of feeding or gonad development, use eviscerated weight, that removes organ weight. In allometric equation you determine b-factor from data of fishes, but Fulton simply estimate weight proportionate to cube of length, so b is a constant.
Different species have different ranges. Research about Fulton’s condition factor show differences between species because of shape and offer own range for every family. Value above 1 is not always best.
For instance Lepomis gibbosus have average 1.4956, while Cobitis elongatoides only 0.4739.
Possible reasons for low Fulton’s condition factor is absence of food or prey, more competition, bad habitat or disease. Environmental and biological elements affect K-factor. Even so it is not very precise by itself.
Sex, season, spawning condition, place, species and size all play a role. The real tie between condition indices, physical composition, life history traits and seasons yet require more research.