Fish Protein Calculator
Estimate fish protein grams from species, fillet type, portion weight, moisture basis, edible yield, reference protein percentage, planned servings, and unit system.
1 Fish Protein Presets
2 Portion and Protein Inputs
Fish Protein Estimate
Full Calculation Breakdown
3 Protein Reference Cards
Lean White Fish
Medium Fillets
Dense Cuts
Yield Impact
4 Reference Tables
| Species preset | Protein reference | Default edible yield | Default form |
|---|---|---|---|
| Atlantic salmon | 20.4 g per 100 g | 95% | Fillet portion |
| Tuna loin | 23.3 g per 100 g | 98% | Boneless loin |
| Cod | 18.0 g per 100 g | 96% | Skinless fillet |
| Tilapia | 20.1 g per 100 g | 95% | Skinless fillet |
| Rainbow trout | 20.5 g per 100 g | 93% | Skin-on fillet |
| Halibut | 18.6 g per 100 g | 82% | Steak section |
| Mahi mahi | 18.5 g per 100 g | 96% | Fillet portion |
| Red snapper | 20.5 g per 100 g | 62% | Cleaned portion |
| Catfish | 16.4 g per 100 g | 94% | Fillet portion |
| Sardine | 20.9 g per 100 g | 100% | Drained packed fish |
| Fillet or portion type | Default yield | What the yield means | Calculator use |
|---|---|---|---|
| Skinless boneless fillet | 100% | Entered weight is edible portion | Protein uses full entered weight |
| Skin-on boneless fillet | 95% | Small non-meat fraction is excluded | Protein uses edible fraction |
| Boneless loin or center cut | 98% | Minimal trim allowance | Protein uses nearly all weight |
| Steak with bone section | 82% | Bone and trim are excluded | Protein uses yield-adjusted weight |
| Cleaned whole portion | 62% | Non-edible structure is excluded | Protein uses edible portion only |
| Drained packed fish | 100% | Entered drained weight is edible | Protein uses full drained weight |
| Moisture or equivalent basis | Density factor | Effect on protein percent | Calculator label |
|---|---|---|---|
| As-entered reference basis | 1.00x | Uses species reference unchanged | Reference basis |
| Drier cooked-equivalent basis | 1.14x | Raises protein density for lower moisture | Drier equivalent |
| High-moisture equivalent basis | 0.94x | Lowers protein density for higher moisture | Moist equivalent |
| Concentrated drained basis | 1.28x | Raises density for compact drained portions | Concentrated |
| Formula step | Imperial input | Metric input | Protein output |
|---|---|---|---|
| Convert weight | Ounces x 28.3495 | Grams unchanged | Total grams entered |
| Apply weight mode | Per serving x servings | Per serving x servings | Total portion grams |
| Apply edible yield | Total x yield percent | Total x yield percent | Edible grams |
| Apply protein density | Percent x moisture factor | Percent x moisture factor | Protein grams |
| Split servings | Total protein / servings | Total protein / servings | Protein per serving |
Reference percentages are calculator defaults for estimating fish protein from weight. Edit the protein percentage field whenever your package, lab, or database reference differs.
5 Species Comparison Grid
Salmon
Fillet reference with moderate density.
Tuna
Dense loin reference for boneless cuts.
Cod
Lean white fillet baseline.
Tilapia
Common mild fillet reference.
Trout
Skin-on fillet default.
Halibut
Large steak section reference.
Mahi Mahi
Lean fillet reference.
Snapper
Cleaned whole portion default.
Catfish
Fillet pack reference.
Sardine
Drained packed fish reference.
6 Calculator Notes
Edible yield note: If the entered weight is already the edible portion, keep yield at 100%. Lower the yield only when the weighed portion includes bone, skin, or other non-edible weight.
Reference note: Species values are defaults for calculator math. Use the editable protein percent field to match a specific data source or product label.
Calculating an amount of protein that is present within fish requires that you understand several specific factor related to fish protein. These factor include the edible yield of the fish, the protein density of the fish species, and the moisture level of the fish. While the weight of the fillet of fish that is measure is often used to estimate the amount of protein that is in the fish, the total weight of the fish fillet does not necessarily equal the edible weight of the fish.
The edible weight of the fish is the weight of the fish that the individual that eat the fish actualy consumed; the edible weight of the fish excludes the weight of the bones, the skin, and the connective tissue of the fish. By ignoring the edible yield of the fish, an individual will overestimate the amount of protein that is contain within the fish; overestimating the protein levels of the fish will lead to inaccurately tracking of the protein levels that an individual consumes. The edible yield of the fish is represent as a percentage.
How to Find Protein in Fish
For instance, a skinless fillet will have an edible yield of nearly 100%, but a steak that contain the bones of the fish will have an edible yield of less than 100%; a fish steak that contains the bones of the fish may have an edible yield of 82%. The edible yield of the fish is applied to the total weight of the fish to determine the edible weight of the fish. The edible weight of the fish can then be used to calculate the amount of protein that is contain within the fish by applying the protein density of the fish.
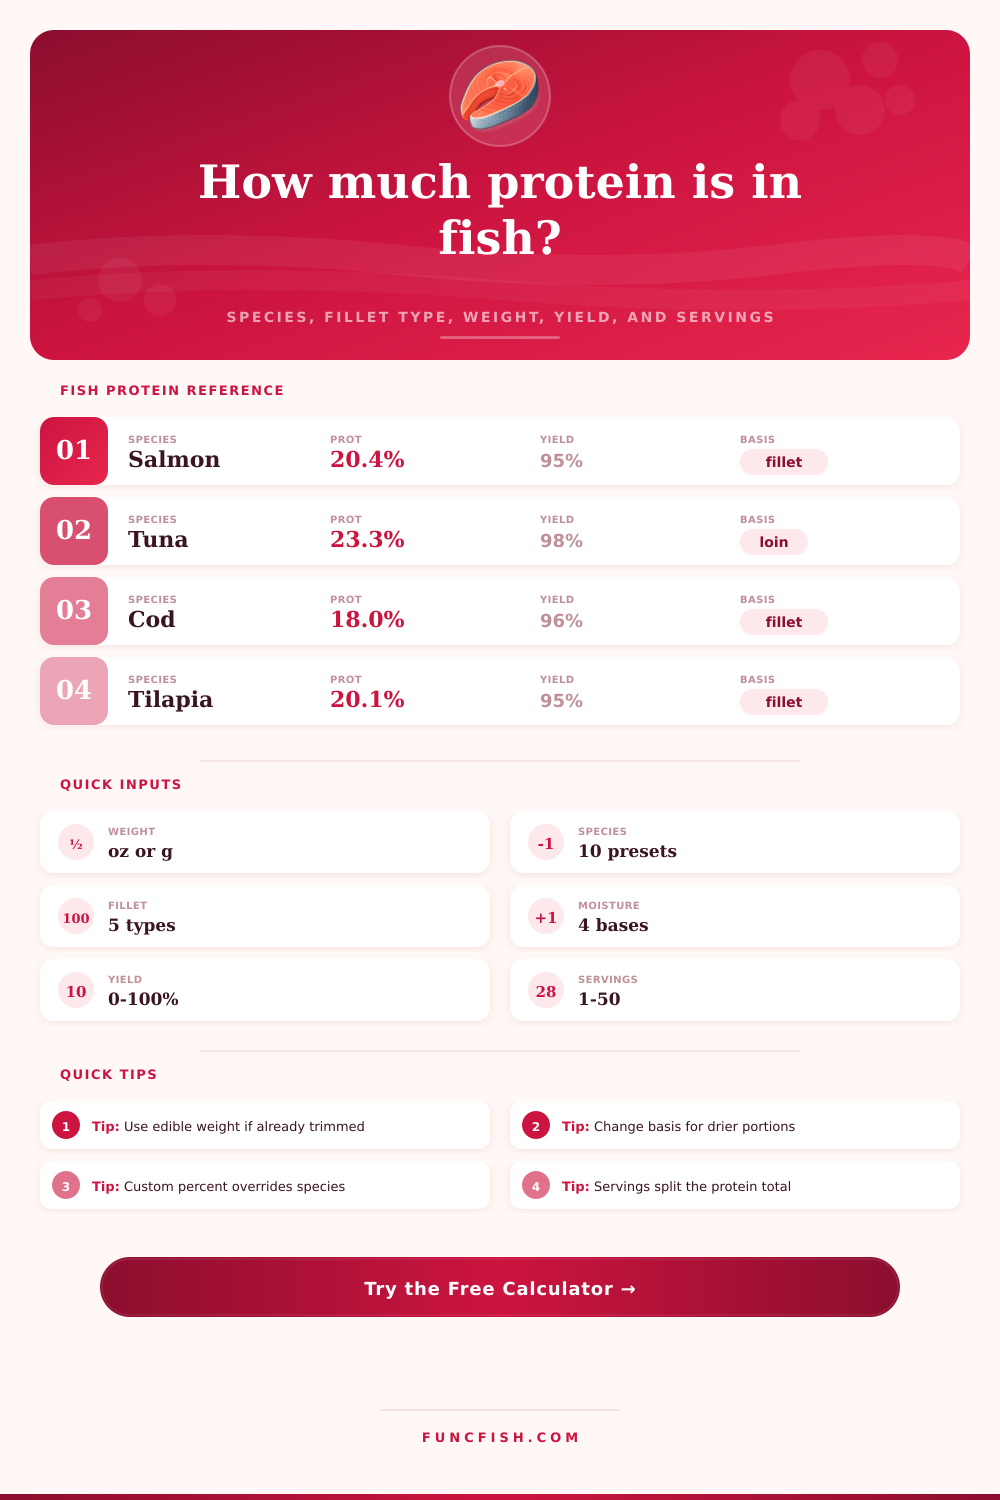
The protein density of the fish is the percentage of the edible weight of the fish that is compose of protein; different species of fish contain different amount of protein due to the different body makeups of those species. For instance, Atlantic salmon contains 20.4% protein by weight, while tuna contains 23.3% protein by weight. Thus, tuna contains more protein per gram of edible fish meat then Atlantic salmon contains.
These percentages can be used to calculate the total gram of protein that is present within the portion of fish that is consume. One other factor that may impact the calculation of the amount of protein within the fish is the moisture level of the fish. The moisture content of the fish can change with the cooking process; as the water in the fish evaporate during the cooking process, the protein of the fish becomes more concentrate within the edible meat of the fish.
The protein density of the fish can be adjusted for the amount of moisture in the fish; the drier the fish is, the more higher the protein density. Additionally, the weight of raw fish differ from the weight of cooked fish; the protein density of cooked fish is higher than the protein density of raw fish. Thus, if you are to calculate the protein concentration of the cooked fish, you should consider the difference between raw and cooked protein density when determine the amount of protein of the fish.
The calculations of protein density within the fish can be utilized to help manage the portion of fish that may be serve to individuals in a meal. For instance, if an individual has a large amount of fish, such as 900 gram of mahi mahi, he or she may wish to determine how to divide the total grams of protein from that fish into each individual that is to eat the mahi mahi. If four individuals are to eat the mahi mahi fish, then the total grams of protein from that fish should be divide by four; this will produce the amount of grams of protein that each individual should be serve.
By calculating the protein content of fish portions, individuals can ensure that each person who eat the meal receives the correct amount of protein throughout the day. Some common mistake include ignoring the edible yield of the fish and ignoring the moisture level of the fish. If edible yield is ignore, an individual will overestimate the amount of protein that is contain within the fish.
Additionally, if moisture content is ignore, the same calculation will lead an individual to overestimate the protein levels of the fish. To avoid these common mistake, edible yield should first be calculate, and then protein density should be calculate according to the edible yield of the fish. By following these step, individuals can ensure that protein content calculations is accurate.