Fish Standing Crop Calculator
Estimate total fish biomass, density per acre or hectare, likely fish count, and carrying-capacity margin from pond size, sample catch, capture efficiency, and management target.
📌Standing crop presets
⚙Crop survey settings
Standing crop estimate
Full calculation breakdown
🧪Survey condition data
Open Shoreline
Moderate Cover
Dense Vegetation
Aerated Fed
📏Standing crop density reference
| Fishery type | Conservative crop | Managed crop | Heavy crop warning |
|---|---|---|---|
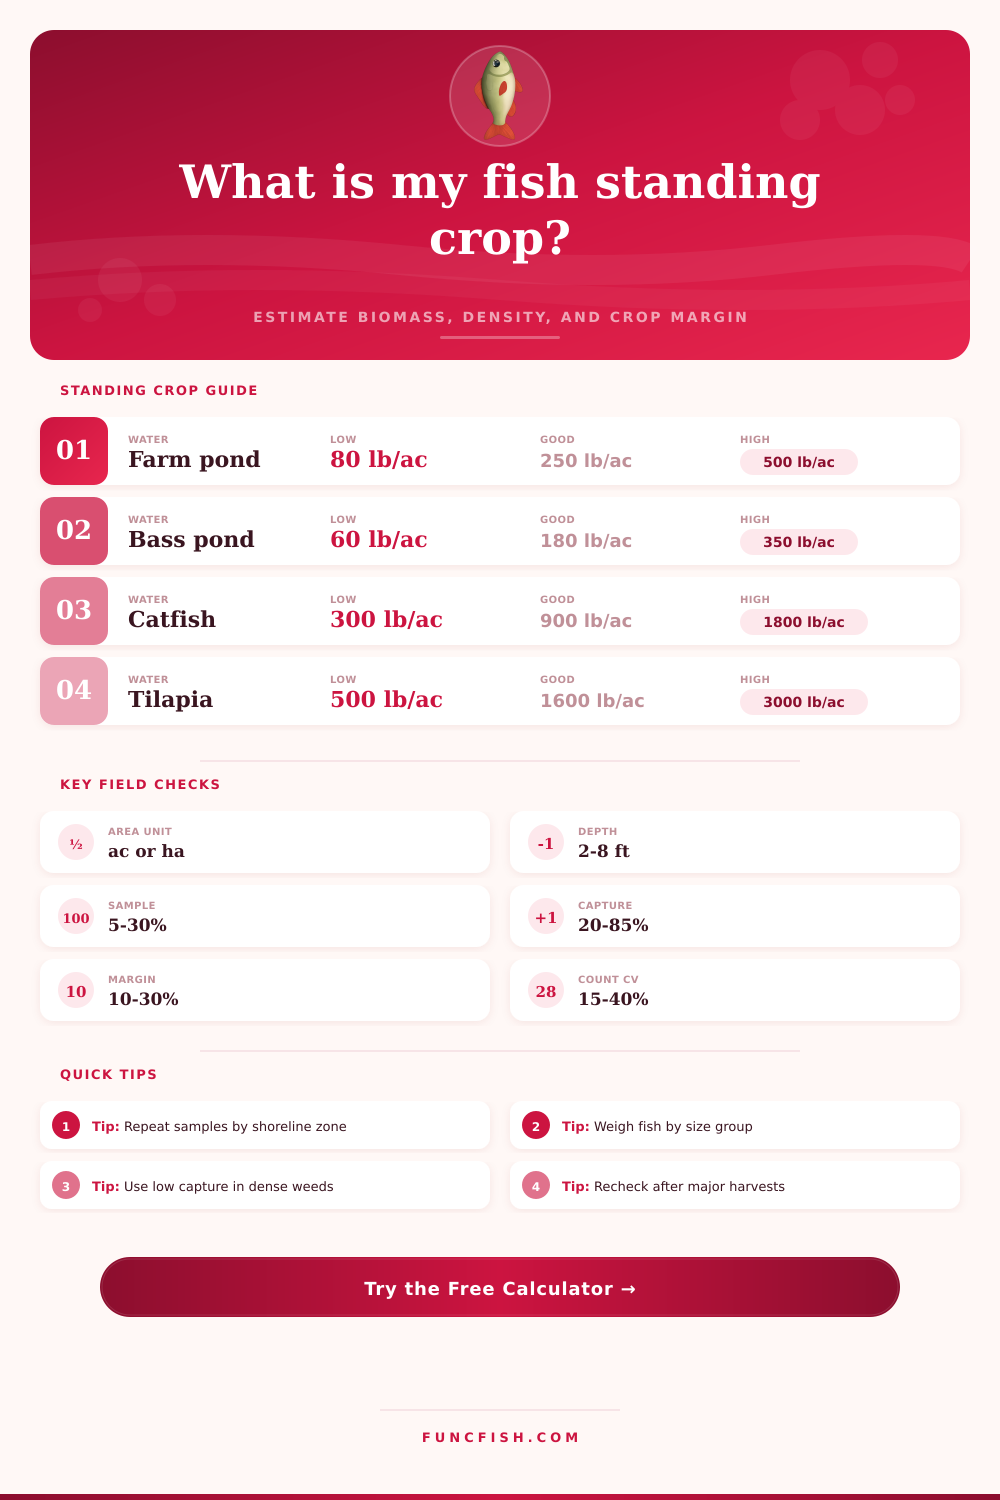
| Unfed bass-bluegill pond | 60-120 lb/ac / 67-135 kg/ha | 150-300 lb/ac / 168-336 kg/ha | More than 400 lb/ac may strain prey balance |
| Mixed farm pond | 80-160 lb/ac / 90-179 kg/ha | 200-450 lb/ac / 224-504 kg/ha | High biomass needs oxygen checks in summer |
| Fed channel catfish pond | 300-700 lb/ac / 336-784 kg/ha | 800-1800 lb/ac / 896-2017 kg/ha | Harvest before oxygen demand spikes |
| Tilapia production pond | 500-1000 lb/ac / 560-1121 kg/ha | 1200-3000 lb/ac / 1345-3363 kg/ha | Requires strong feed and oxygen management |
| Trout raceway or cold pond | 0.25-0.5 lb/ft3 / 4-8 kg/m3 | 0.6-1.2 lb/ft3 / 10-19 kg/m3 | Watch flow, temperature, and dissolved oxygen |
🔍Sampling efficiency table
| Sampling method | Typical capture efficiency | Best fit | Common bias |
|---|---|---|---|
| Seine haul or block net | 35-70% in sampled zone | Shallow ponds, fry, forage, small fish | Misses fish in brush, deep holes, and weeds |
| Electrofishing | 20-55% for shoreline fish | Bass-bluegill balance and species checks | Size and conductivity affect catchability |
| Trap net or fyke net | 10-35% over set area | Crappie, panfish, catfish movement samples | Active fish enter gear more often |
| Mark-recapture | Estimator based on recaptures | Larger ponds where repeated sampling works | Needs enough marked fish mixed back in |
| Drain-down inventory | 80-98% of water body | Small production ponds and raceways | Stress losses can reduce live count |
| Feed response estimate | Rough biomass back-calculation | Catfish, tilapia, koi, and fed fish | Appetite changes with weather and oxygen |
🐟Species and management target table
| Species group | Typical average weight | Standing crop target | Management reading |
|---|---|---|---|
| Largemouth bass mix | 0.25-2.5 lb / 0.11-1.13 kg | 60-120 lb/ac predator crop | High count with low weight suggests crowding |
| Bluegill or sunfish forage | 0.03-0.4 lb / 14-181 g | 80-250 lb/ac prey crop | Many size classes usually indicates recruitment |
| Channel catfish | 0.5-3.5 lb / 0.23-1.59 kg | 800-1800 lb/ac in fed ponds | Crop can exceed natural pond oxygen capacity |
| Tilapia | 0.15-1.5 lb / 68-680 g | 1200-3000 lb/ac with feed | Standing crop changes fast in warm water |
| Trout | 0.1-2.0 lb / 45-907 g | 0.6-1.2 lb/ft3 with flow | Use volume density when water exchange is high |
| Koi or ornamental fish | 0.25-8 lb / 0.11-3.63 kg | Conservative crop by filtration and oxygen | Large individuals dominate biomass quickly |
🧮Area and volume conversion table
| Measure | Imperial equivalent | Metric equivalent | Use in calculator |
|---|---|---|---|
| Surface area | 1 acre | 0.4047 hectares | Primary divisor for standing crop density |
| Biomass density | 1 lb/acre | 1.1209 kg/hectare | Converts pond targets across unit systems |
| Water volume | 1 acre-ft | 1233.5 cubic meters | Useful for raceway and oxygen load context |
| Weight | 1 pound | 0.4536 kilograms | Converts sampled biomass and total crop |
| Depth | 1 foot | 0.3048 meters | Estimates water volume from surface area |
📊Assessment comparison grid
Inventory crop
Drain-down or a near-complete seine gives the cleanest standing crop number because coverage and capture corrections stay small.
Population sample
Electrofishing is useful for balance checks, but biomass expansion should use cautious capture efficiency when fish are patchy.
Production pond
Fed systems can hold a heavier crop, so the target density should reflect aeration, feeding, and harvest schedule.
Harvest decision
Positive margin points to stocking room, while negative margin estimates how much biomass should be harvested or thinned.
💡Practical crop notes
Pair biomass with size structure. A pond can have the same standing crop at very different fish counts, so separate sample weights by species or size class whenever possible.
Treat the confidence band as a field reality check. Patchy cover, schooling baitfish, and one-pass sampling can move the real crop well above or below the midpoint estimate.
That’s why looking at water can be like trying to look through fogged up glasses. When you pull up to the edge of your pond and see a school of fish busting around the dock, it looks good, right? But how many fish are there actualy? Are they all bunched-up in whatever little bit of oxygen remains? Do you have enough space to add more? If you’re like most pond managers, you don’t have the answers and waste time and money because of it.
That’s what this calculator does for you. Once you plug in your sample weight and capture efficiency, it will do the math for you so you’ll never again worry about those pesky conversions and coefficients. It makes that unclear water crystal clear.
How to Count Fish in Your Pond
Standing crop isn’t just a headcount. Standing crop is the total weight of living fish biomass per unit of area. You could have a thousand tiny fingerlings in a pond or a bunch of big bass. But they could has the same standing crop. The weight is more important then the number of heads because it has more biological impact on both food supply and oxygen. Overcrowding doesn’t always manifest as too many fish. It shows up as too much demand on the limited resource.
What you see when you sample (with an electrofisher or seine) is only a fraction of what’s present. The tool accounts for that gap with something called capture efficiency. Your net captures half the fish in that zone? The algorithm doubles its estimate to account for the rest. It’s primarily about knowing what you’re measuring.
Depending on habitat conditions, capture efficiency can range from nearly one hundred percent, to as little as twenty five percent (or even less). A seine catches a good 55 percent of target species on an open shoreline in clear water. But maybe it catch only twenty-five percent in muddy water or heavy vegetation. Plug in a high capture efficiency for a weedy pond and your estimated final biomass will fall well below reality. You’ll feel like there’s plenty of room left to stock and it turns out…you’re over the limit. The page has a handy reference table laying this out clearly, which reminds us that habitat structure drives sampling bias.
Fish don’t swim away from us so much as they do hide. Different species support different loads. Three-hundred pounds per acre seems to be the maximum point for bluegill ponds and unfed bass ponds where there is some growth stalling or imbalance in predation. Fed tilapia or fed catfish systems can reach towards two-thousand pounds per acre but only when they are being managed with intense dissolved oxygen management and regular feeding.
You can enter your target carrying density into the calculator and it will let you know if you’re over or under carrying capacity. It also calculates a margin which should of act as a harvest signal. If your margin is positive then you still have space for stocking or growing. If your margin is negative then it’s telling you that it’s time to start pulling fish out before the summer heat spike arrives.
The confidence adjustment gets overlooked by folks. But we can’t trust single samples when the fish aren’t distributed evenly across the water. They stack up around structure, shorelines and other forms of cover. The confidence band is wider because we know that if you get a good bite in a rich area of baitfish, then you’ll be overestimating the entire pond. Likewise, if you’re away from the main school, then you’ll be underestimating it. You don’t want to make large decisions with one lone lucky (or unlucky) haul.
The other side of the equation is harvest. How do you manage that without draining the pond? The answer is to know your standing crop and keep it down with regular sampling and smart removals based off estimates, where you thin the smaller ones while making sure your keepers grow at a good rate, all while maintaining water quality. Knowing what’s in there, and having the number as your starting point, allows you to track changes over time and know whether the standing crop has crept upwards toward dangerous levels. Know that before the oxygen goes down and the algae blooms.
Measure what you can see and trust the math for what you can’t.