Fish Exploitation Rate Calculator
Estimate annual exploitation rate, fishing mortality, total mortality, biomass removed, and escapement from stock size, catch, release mortality, and species-specific natural mortality.
Scenario presets
Exploitation inputs
Exploitation estimate
Calculation breakdown
Live reference checks
F plus M, unless observed Z overrides the estimate.
Fishing pressure relative to background natural mortality.
Expanded fishing deaths times average vulnerable fish weight.
Fish above or below the selected exploitation ceiling.
Risk comparison grid
Light
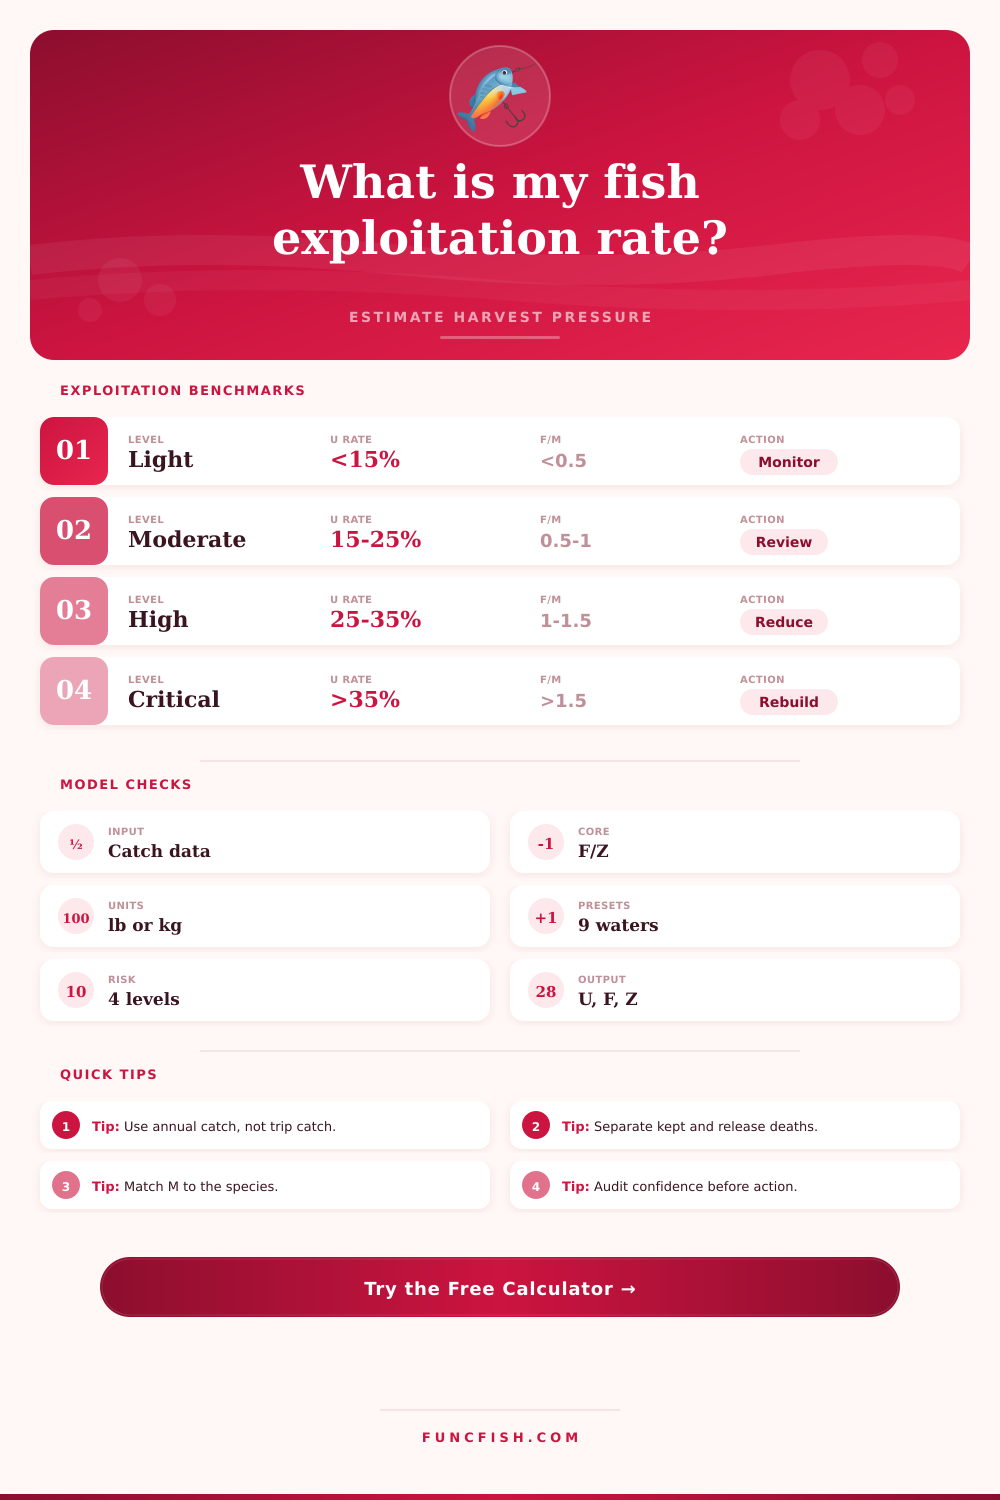
U below 15% or F/M below 0.5. Usually a monitoring and trend-confirmation zone.
Moderate
U from 15% to 25%. Watch year-class strength, angler effort, and size structure.
High
U from 25% to 35%. Confirm survey coverage and evaluate whether removals are sustainable.
Critical
U above 35% or F/M above 1.5. Treat as a strong signal for rapid management review.
Reference tables
| Species group | Typical M | Cautious U range | Interpretation note |
|---|---|---|---|
| Largemouth bass | 0.18-0.30 | 15-25% | Adult bass often need moderate exploitation to protect size structure. |
| Stream trout | 0.30-0.60 | 20-35% | Shorter lived stocks can tolerate more turnover when recruitment is stable. |
| Walleye | 0.18-0.32 | 12-25% | Exploitation should be checked against year-class strength and adult density. |
| Channel catfish | 0.12-0.25 | 15-30% | Stocked waters may support higher harvest when recruitment is replaced. |
| Panfish | 0.35-0.70 | 25-45% | Higher natural mortality and fast turnover can support higher U in many lakes. |
| Pike and red drum | 0.18-0.32 | 10-22% | Lower exploitation is prudent for trophy or older age classes. |
| Method | Main data | Best use | Common bias to check |
|---|---|---|---|
| Creel survey | Kept catch, releases, effort | Annual harvest pressure and angler removals | Incomplete coverage, recall error, access-point gaps |
| Tag return | Tagged fish, returns, reporting | Direct exploitation estimate from returned tags | Tag loss, nonreporting, different vulnerability of tagged fish |
| Telemetry | Known-fate survival records | Partitioning fishing and natural mortality | Small sample size and transmitter effects |
| Catch curve | Age structure or length cohorts | Total mortality Z and trend comparison | Recruitment variation and gear selectivity |
| Formula item | Symbol | Calculator use | Plain meaning |
|---|---|---|---|
| Exploitation rate | U | Fishing deaths / exploitable stock, or Baranov U | Share of vulnerable fish dying from fishing in one year |
| Fishing mortality | F | Solved from U and M when direct F is blank | Instantaneous fishing death rate |
| Natural mortality | M | Species preset or custom input | Deaths from non-fishing causes |
| Total mortality | Z | F + M unless observed Z is supplied | All annual instantaneous mortality combined |
| Baranov catch share | F/Z x (1 - e^-Z) | Checks catch against F and M | Fishing portion of total annual deaths |
| Data quality | Coverage guide | Buffer guide | When to rerun |
|---|---|---|---|
| High confidence | 90-100% | 0-8% | Annual stock estimate and full-season harvest data align |
| Moderate confidence | 70-89% | 8-18% | Some access points, nights, or release deaths are estimated |
| Low confidence | 45-69% | 18-35% | Harvest survey misses a large part of effort or season |
| Screening only | Under 45% | 35%+ | Use only for a rough planning flag before better sampling |
Practical tips
“Every time you see a bass break the surface and you catch it, it’s not just that one fish. It’s a piece of a bigger biological puzzle. What happens when you take that fish out? Will water body collapse the following year? That’s really the question we’re asking. There are lines in the water pulling back at stock size. If the pull is too great for population to replenish, then you won’t be able to take any out. That’s called exploitation rate. How much pressure are you putting on the fishery compared to it’s ability to recover?”
After you enter in your abundance estimate and catch numbers, the calculator crunches the numbers for you. There is no conversions or coefficients to guess about. Instead, you get a very clear view of risk associated with your catches. This view takes into consideration both the fish that made it into the cooler and the fish you released that didn’t make it back.
How to Keep Fish Populations Healthy
While most anglers think only about what goes in the cooler, biologists understand that the fish that don’t go into the cooler due to hooking stress also matter. So if I handle five-hundred fish and 20-percent die due to hooking stress, those dead fish still contribute to overall mortality rate. And when we ignore them, we give ourselves a false sense of security. The stock is still losing some member, even if they aren’t going onto your dinner plate.
To interpret the result, know that there’s a distinction between fishing pressure and natural mortality. Natural mortality refers to any factor that kills fish aside from humans: disease, old age, predators, environmental factors, etc. Then there’s fishing mortality, which account for the extra death rate due to human activity. When you see the F to M ratio in the output, this tells you how much extra stress you’re putting on the system with your gear. If it’s less than 0.5, you can assume you’re not putting too much pressure on them; if it’s greater than 1.5, you can assume fishing is dominating the death rate. Knowing this helps you determine if you should of been concerned about overfishing or simply normal biological replacement.
The tool also takes into consideration data quality, one of the most vulnerable links in fisheries management. Because survey coverage depends off how complete the creel census is and how many anglers report back on what they caught, you’ll have a poor estimate if only 50% of anglers return it. It results in dangerous underestimates of pressure. To protect against this type of error, it adds an uncertainty buffer by pushing the estimate higher to account for missing data. This protects managers from making decisions based off incomplete information that appears to look better than it actualy does.
One size doesn’t fit all, how different species will react to harvest pressure varies greatly. For example, panfish such as bluegill reproduce rapidly, have high natural mortality, and can sustains higher levels of use before crashing. On the other hand, slow-growing trout and trophy pike requires lower levels of harvest to maintain a healthy age structure, since they don’t reach maturity quickly and live much longer. Built into the tool are reference tables that provide benchmarks for these varying life histories, helping you understand your particular scenario instead of comparing apples to oranges.
Presets can help you get started in typical situations, but nothing ever replace looking closely at real world data. This applies whether you’re managing a public lake based off creel survey results or a small private pond. You want a good estimate of numbers caught. You need honest reporting of the catches. You also need a reasonable understanding of release mortality. The input data has to be solid. Bad data will produce a misleading outcome. That’s because the tool use an uncertainty buffer to help protect against bad or incomplete data.
And really, all this isn’t about taking away fun so much as preserving the fishery for our own benefit in the coming seasons. If recruitment is good, then there’s nothing wrong with a high exploitation rate. It just means you should be watching trends carefuly. Your goal is to hover somewhere in the middle: the stock is still robust enough to rebound from poor years, yet you feel satisfied with your catch. Each year is one more chapter in a long talk with the water, and by paying close attention to what happens on the other side, you know the fish will continue breaking the surface for anyone who chooses to listen.