Fish Hepatosomatic Index Calculator
Estimate hepatosomatic index, liver-free body mass, gonadosomatic index, and reference status from whole fish, liver, gonad, and body condition measurements.
📌Biology presets
⚙Sample inputs
Hepatosomatic index results
Calculation breakdown
🧪Species profile grid
Often shifts upward before spawning or heavy feeding.
Energy reserves can drop during migration or stress.
Culture feeds and warm water can raise liver fraction.
Interpret against species, season, sex, and sampling method.
📊Comparison grid
Direct liver weight divided by whole fish weight, multiplied by 100.
Difference from your entered local baseline or project reference.
Useful when total organ packet weight is measured in the field.
Based on sample count and whether values are one fish or a mean.
📘Reference tables
| HSI band | Typical meaning | Common context | Next calculation check |
|---|---|---|---|
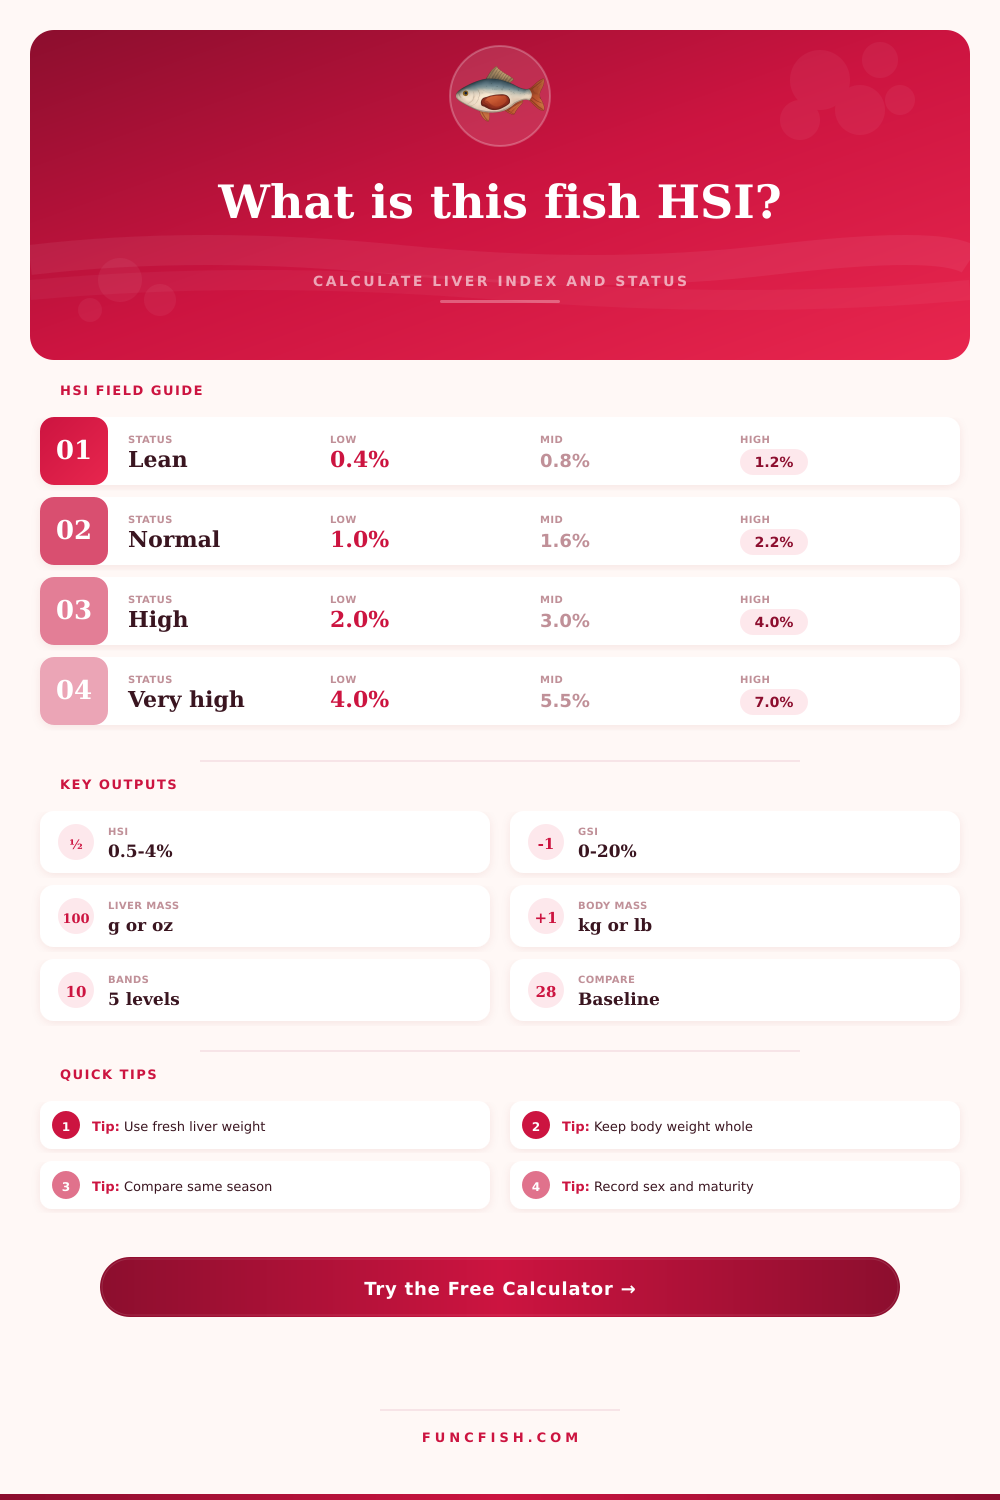
| Under 0.6% | Very low liver fraction | Fasting, migration, stress, or poor condition | Check condition factor and stomach fullness |
| 0.6% to 1.2% | Lean to moderate reserves | Cold water, post-spawn, or low ration periods | Compare against same-season baseline |
| 1.2% to 2.4% | Common field range | Many wild freshwater samples | Review sex, maturity, and diet status |
| 2.4% to 4.0% | Elevated liver fraction | Heavy feeding, culture fish, or pre-spawn energy storage | Check GSI and viscera share |
| Over 4.0% | Very high HSI flag | Culture diets, fatty liver risk, or species-specific high baseline | Confirm weighing method and tissue moisture |
| Species profile | Reference band | Useful baseline | Interpretation note |
|---|---|---|---|
| Largemouth bass | 0.9% to 2.4% | 1.6% | Pre-spawn females may rise with feeding and gonad growth |
| Rainbow trout | 0.7% to 2.1% | 1.4% | Stress checks should compare fish from the same handling window |
| Channel catfish | 1.0% to 3.2% | 2.1% | Fed pond fish often sit above wild river samples |
| Tilapia | 1.4% to 3.8% | 2.5% | Warm culture and ration changes can move HSI quickly |
| Walleye | 0.7% to 2.0% | 1.3% | Post-spawn fish may carry lower liver reserves |
| Sample handling | Weight effect | Calculator correction | Use when |
|---|---|---|---|
| Fresh wet weight | Reference method | 0% | Fish and organs weighed soon after sampling |
| Blotted organs | Removes surface water | 0% | Standardized field work with consistent blotting |
| Previously frozen | Possible drip loss | +2% liver estimate | Frozen samples thawed before organ weighing |
| Fixed tissue | Shrinkage or fluid shift | +8% liver estimate | Only when fresh tissue weight is unavailable |
| Batch mean | Variation is hidden | No mass correction | Inputs represent mean fish and organ weights |
| Related index | Formula | What it adds | Best comparison |
|---|---|---|---|
| HSI | Liver weight / body weight x 100 | Energy storage and liver allocation | Same species, season, sex, and method |
| GSI | Gonad weight / body weight x 100 | Reproductive investment | Sex and maturity class |
| VSI | Viscera weight / body weight x 100 | Total organ and gut fraction | Feeding status and culture ration |
| Fulton K | 100 x weight g / length cm cubed | Body condition by length | Species and length group |
💡Calculation tips
Now you land a largemouth bass, pull it out of water and see that it appears overweight for its size. There is crayfish and bluegills in its gut; so the bass must have eaten recently. But what does all this extra girth mean? Is it all muscle mass? Or perhaps it has fat liver full of glycogen reserves.
That question is important, since body condition are no one-dimensional number. Rather, it represent the balance of structural tissue against investment in making offspring and energy stores. The hepatosomatic index remove that uncertainty by focusing on how much the liver weigh as a percentage of overall body mass. Fish have a metabolic engine: their liver. Like our battery, it’s where they store energy and process nutrients. So when you read an HSI, you’re reading the battery charge level.
What Is the Hepatosomatic Index?
If the index increase, it may mean the fish are preparing to spawn or is in good feeding conditions. But if it decrease, it could of be from recent egg release or stress and starvation of migrating. All you do is plug in your wet weights and let calculator do the math. That eliminate unit errors and the hassle of converting manually. Just make sure you enter consistent values.
Generally speaking, denominator should reflect the total physical load carried by fish and that mean whole wet body weight. Changes from whole mass to liver-free mass (or vice versa) mid study adds noise which hides true biological signal. These numbers are relative. They depend on context. What seems like a high 2.0 percent for a wild trout fresh out of winter hibernation? It could be right-on-normal for fat-and-sassy channel catfish living happy in an unpressured culture pond with ample feed.
That’s where the species profile in the tool help set your expectation. It acknowledges that we’re not all on the same metabolic clock: Salmonids don’t run at the same pace as bass. It’s better to compare to a seasonal benchmark (or a site-specific one) different than to get hung up on a mythical “healthy” reading. Because fish physiology adjust quickly to changes in reproduction, temperature and diet, a momentary read is just half the picture.
There are other small but important variable introduced by the way we handle fish. If not controlled for, they can skews your data. For example, blotting the liver off remove water from its surface so it won’t add phantom weight. Tissue can shrink (or be lost through drip loss) during freezing. Flagging these handling states within the calculator will apply minor corrections so your comparisons remains honest. Note this when looking for a three percent shift in condition between two population. When you’re trying to measure biology, you don’t want to be measuring the moisture content of your scale tray. How you handle every sample is as important as precision with which you make the measurement itself.
There’s also the added element of reproduction. Liver reserve level can vary according to reproductive status as well. Females getting ready to spawn tend to have higher liver reserves because they are building up their gonads. After spawning, fish might has low liver reserves due to egg release. To further distinguish overall body condition from reproductive burden, it’s worth adding gonadal weight into the equation. Otherwise, you might misinterpret an overburdened ovary (or vice versa) as an overdeveloped digestive system.
The bands is clearly laid out in the reference tables provided with the tool and allow you to determine if a given value is elevated, normal, or lean compared to what you’d typicaly see in the field. But it’s the long term monitoring that makes this so powerful. A single measurement don’t tell the whole story. Long-term tracking of HSI allow for seeing trends that would be otherwise obscured by single measures. These include seasonal temperature fluctuations, stocking events, and changing baitfish presence.
It paints a picture based off your data as opposed to raw numbers. So it’s not just fishing but evaluating life history strategy, energy budget, and more. Weighing a fish isn’t enough. Now you’re evaluating the fish on something else entirely. Take an additional second next time you weigh a fish and write down liver weight as well. That little detail will make your length-and-weigh sampling much richer and help paint a clearer picture of what’s going on with those fish. It provides some clarity to the basic biology behind aquatic health. What was once a snapshot of biomass becomes a story of growth and survival.