Fish Shrinkage After Death Calculator
Estimate post-death length and weight shrinkage from the measured fish, species profile, holding time, temperature, rigor stage, surface moisture, and measurement method.
📌Field presets
⚙Shrinkage inputs
Shrinkage correction results
Calculation breakdown
📊Model checkpoints
Uses species body response plus holding time, temperature, rigor, and measuring surface.
Adds drip loss and surface drying to the species and temperature curve.
Cold, wet holds slow change; warm, dry air raises the adjustment quickly.
Photo, frozen, warm, and delayed measurements receive wider correction intervals.
🗂Comparison grid
Best evidence when the fish is measured soon after death on a wet, flat board.
Length usually shifts less than weight, but rigor and dry spots still matter.
Evaporation and tissue relaxation widen both the correction and the uncertainty band.
Thaw drip, curve memory, and surface glaze make the back-correction less precise.
📋Reference tables
| Species profile | Body response | Base length shrink | Base weight shrink | Use when |
|---|---|---|---|---|
| Bass or perch-like | Moderate depth, firm body | 0.30% | 0.90% | Largemouth, smallmouth, white bass, perch-shaped fish |
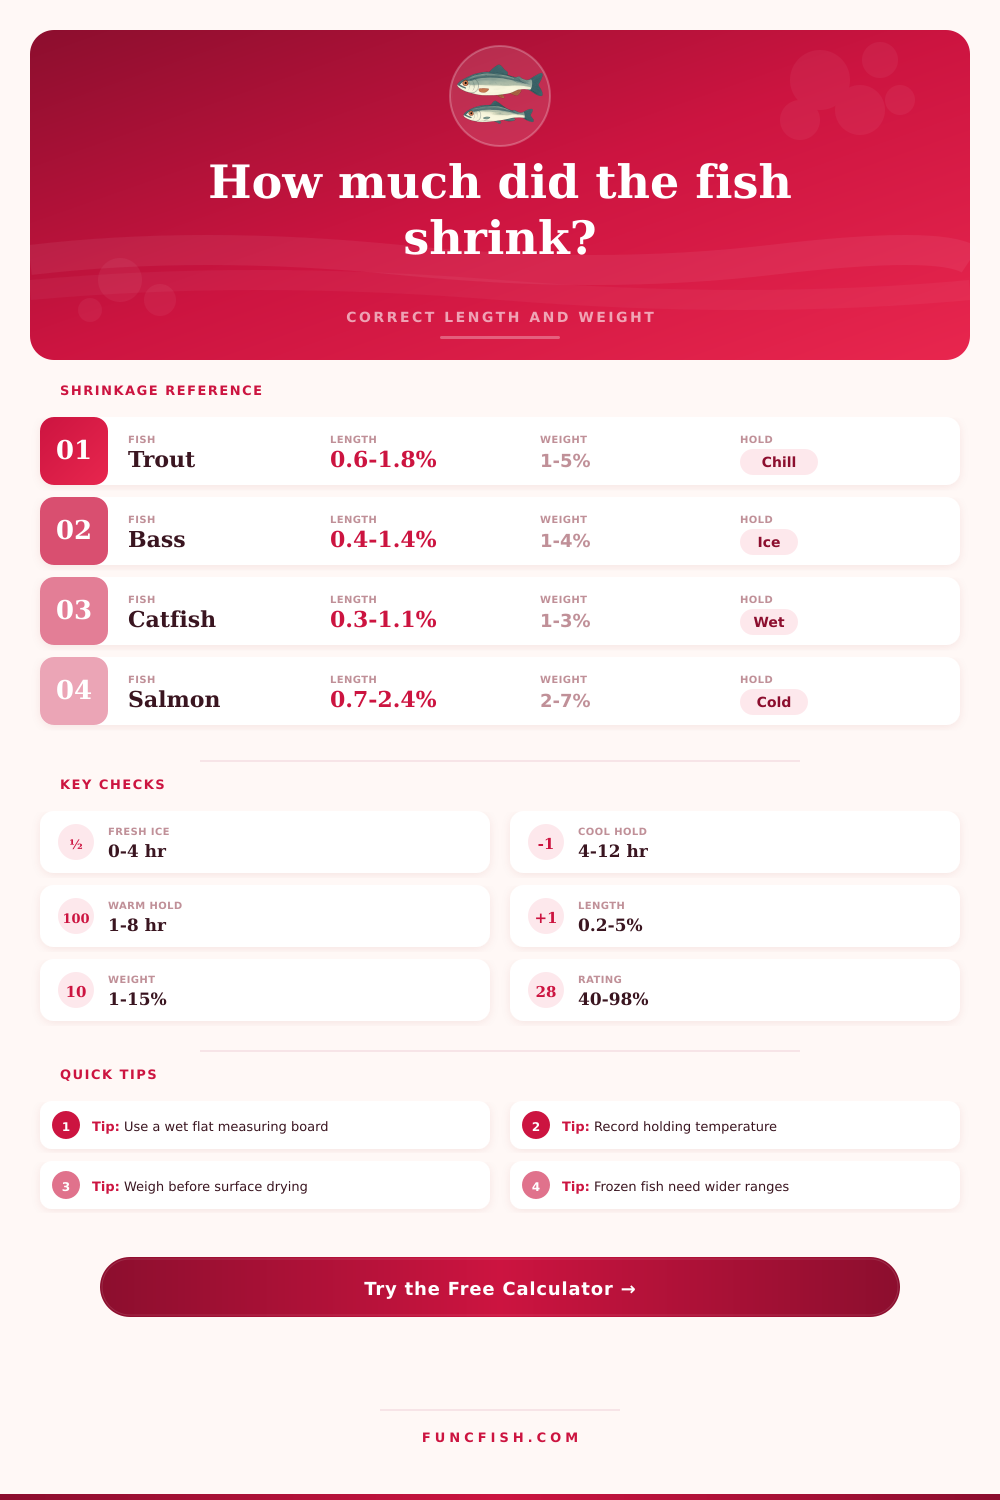
| Trout or char | Soft slender body | 0.45% | 1.20% | Stream trout, stocked trout, char, grayling-like fish |
| Walleye or zander | Long firm body | 0.35% | 1.00% | Walleye, sauger, zander, similar percids |
| Catfish or bullhead | Thick skin, lower length shift | 0.20% | 0.80% | Channel catfish, blue catfish, bullheads |
| Salmon or steelhead | Large soft tissue mass | 0.55% | 1.60% | Salmon, steelhead, sea trout, large anadromous fish |
| Pike or muskie | Very long slender body | 0.50% | 1.10% | Pike, muskie, pickerel, long gar-like records |
| Holding method | Length effect | Weight effect | Confidence effect | Primary issue |
|---|---|---|---|---|
| Iced and wet | +0.05% | +0.35% | +4 points | Slow tissue change with limited drying |
| On ice, surface drying | +0.14% | +0.95% | -2 points | Dry skin and exposed fin edges |
| Cool air or shaded cooler | +0.28% | +1.35% | -6 points | Moderate surface evaporation |
| Warm air or bank hold | +0.60% | +3.20% | -16 points | Fast drying and soft tissue loss |
| Frozen then thawed | +0.75% | +4.10% | -20 points | Thaw drip and curve memory |
| Brine or ice slurry | +0.02% | +0.20% | +6 points | Very cold wet contact |
| Time and temperature band | Length range | Weight range | Rating impact | Planning note |
|---|---|---|---|---|
| 0 to 2 hr, 32 to 40 F | 0.1 to 0.7% | 0.4 to 2.0% | High | Best delayed measurement window |
| 2 to 8 hr, 34 to 45 F | 0.4 to 1.6% | 1.0 to 4.5% | Good | Common iced cooler correction range |
| 4 to 12 hr, 46 to 60 F | 0.9 to 2.8% | 2.5 to 8.0% | Fair | Temperature estimate becomes important |
| 1 to 8 hr, above 65 F | 1.3 to 4.5% | 4.0 to 13.0% | Low | Warm dry holds need wider intervals |
| Frozen and thawed | 0.8 to 5.0% | 4.0 to 15.0% | Low | Use range, not a single exact number |
| Measurement method | Length precision | Weight precision | Best match | Watch item |
|---|---|---|---|---|
| Wet flat board | Highest | No effect | Direct length correction | Keep snout against stop |
| Dry board | Good | No effect | Cooler or dock checks | Skin drag can shorten body set |
| Soft tape over curve | Moderate | No effect | Large fish on uneven ground | Curve adds method error |
| Photo scale | Variable | No effect | Delayed photo reconstruction | Lens angle and scale placement |
| Mixed note sources | Low | Variable | Old log back-correction | Round values and missing time |
💡Calculation tips
So you land a big bass and envision it hanging on your wall. You grab scale and discover that fish is much lighter out of the water then it was in the water. Don’t fret; this isn’t just your imagination, the fish will actualy decrease in both length and weight upon exiting the water. Rather than guessing whether your scale reading is correct or if your fish has experienced some normal biological weight loss, simply input your holding conditions into the shrinkage calculator above and let it crunch the numbers for you.
Most of that is due to moisture loss. Once a fish is dead, its skin will not seal as well to retain fluids. Then if you put it in a warm cooler without good air flow, the meat will lose weight rapidy through evaporation. Even if the meat doesn’t spoil from the warm water, it will dry on the outside. That alone can causes several percent of the total weight loss before anything goes bad.
Why Your Fish Shrinks After You Catch It
Time and temperature is important factors. If you weigh a fish right when you catch it and then again 6 hours later on ice, the weights will be two different numbers. To account for that the calculator allows you to enter how you held the fish and at what temperature. Warm air exposure will speed the process up a lot. Wet and iced holds will slow it way down. To recieve a true correction, you have to understand what situation your fish was in.
But length shrinkage is more than mere water weight; it’s also about muscle structure. When a fish dies, its muscles enters into rigor mortis, they stiffen and shorten in length. If you stretch that fish out onto a measuring board, you might notice that it seem to shrink ever-so-slightly. After rigor resolves, the fish will soften back up. But instead of a specific number, you’ll get a range that tells you where live weight likely fell.
How does the rigor mortis affect your tape measure readout? Species profiles estimates this type of structural change for you. A thick-skinned catfish won’t behave identically to a slender trout. Those body response factors is built into the model so you don’t have to remember the biological quirks of each species you encounter.
There is inherent uncertainty because many people think the whole fish shrinks uniformly, but it does not. Fish hanging in a brine slurry retain far more mass than those hanging on a dry dock. It’s this lack of certainty that shapes the confidence rating in the results. When there’s a frozen-and-thawed fish involved or when you’re performing photo scaling, the margin of error grow considerably wider. In those instances, you can’t say precisely what live weight would be; the circumstances are simply too variable. All you know is that it was somewhere within a certain range and in many situations, that range is more valuable than the illusion of accuracy.
The real world rarely aligns with any textbook scenario. Maybe it’s a combination of direct sun and ice melt or maybe you had an hour of no livewell power. Such variables makes the calculations more complicated. Why does it ask for a handling compression score? Because when you squeeze a fish along the side of your boat, you deform its shape. Each rough handling of a dead fish add physical distortion which is indistinguishable from shrinkage. This also highlights the importance of getting the temperature right. Half a pound of corrected weight on a big one can be shifted with just a few degrees change in hold temp due to differing rate of evaporation.
Keeping a log of what you catch provides a common way to standardize your logbook. Want to know if today’s bass are larger (or smaller) then last year’s? You have to account for the time that has elapsed since catching them until they were measured. Or else you’re comparing apples to oranges; the conditions aren’t the same. The embedded reference tables on the page break out effect of the holding times for each species. Soft-fleshed fish like salmon will lose more tissue mass compared to panfish; this is why. Knowing the baseline helps identify outliers in your catches.
Respect the specimen: The measurement game begins here. Minimize the biological distortion that will warp your readings by handling the fish gently and chilling them quick. Once they shrink down, there’s no going back. However, with the tool, you can back-calculate and make an educated guess at what you’ve lost. Your field notes becomes data you can trust.
The next time you catch a keeper, do your best to measure it in the moment. If not, use the tool to piece together the truth from what remains. An accurate number is well-worth the additional minute.