Fish Drag Force in Current Calculator
Estimate hydrodynamic drag, equivalent pull, holding power, Reynolds number, and current-load class from fish size, body shape, orientation, flow speed, and water conditions.
📌Current drag presets
⚙Drag force inputs
Current drag and holding load
Calculation breakdown
🧪Hydrodynamic data grid
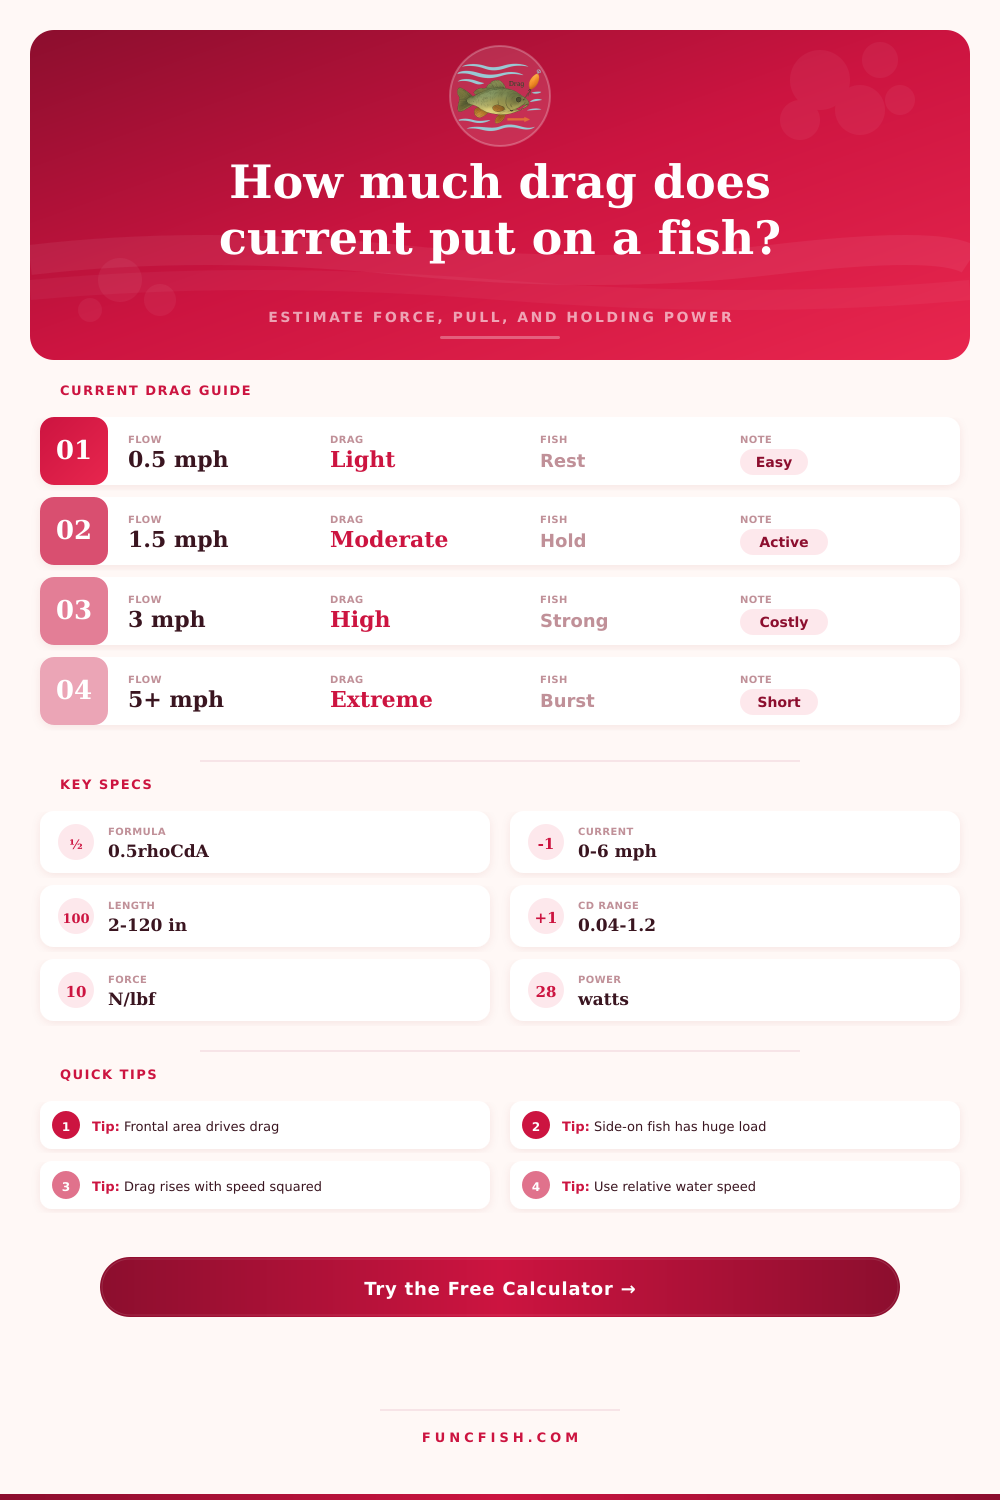
Fd = 0.5 x density x Cd x area x velocity squared.
Streamlined fish are low; broadside or rolling fish are high.
Area facing the flow usually matters more than total length.
Doubling relative current makes about four times the drag.
🧭Comparison grid
Best estimate for a fish actively facing the current with fins tucked and body aligned.
Useful for fish holding beside rocks, bridge pilings, or angled current tongues.
Projected area jumps sharply when a fish turns sideways in flow or is swept by current.
Rolling, tired, tagged, or netted fish can see drag well above the streamlined case.
📘Reference tables
| Fish profile | Typical length | Frontal ratio | Base Cd | Drag note |
|---|---|---|---|---|
| Trout / salmonid | 10-24 in / 25-61 cm | Low | 0.18 | Streamlined body, efficient head-on holding when aligned to flow. |
| Bass / perch | 10-22 in / 25-56 cm | Medium | 0.28 | Deeper body creates more frontal area than trout at the same length. |
| Catfish | 16-40 in / 41-102 cm | High | 0.34 | Broad head and pectoral fins add drag in tailrace current. |
| Carp | 18-36 in / 46-91 cm | High | 0.32 | Rounded body can produce strong drag when angled or broadside. |
| Tarpon | 36-80 in / 91-203 cm | Medium | 0.20 | Large projected area even with a relatively streamlined body. |
| Tuna | 36-100 in / 91-254 cm | Low | 0.12 | Highly fusiform body; drag rises fast at high tow speeds. |
| Current speed | SI speed | Expected drag change | Fish response | Calculator note |
|---|---|---|---|---|
| 0.5 mph | 0.22 m/s | Light | Resting or easy station holding for many fish. | Geometry and area still matter for small fish. |
| 1.5 mph | 0.67 m/s | Moderate | Active holding for trout, bass, walleye, and carp. | Good default for river habitat comparisons. |
| 3.0 mph | 1.34 m/s | About 4x 1.5 mph | Strong current, short station-holding windows for many species. | Power output becomes important. |
| 5.0 mph | 2.24 m/s | Extreme | Usually burst, passage slot, surf, or tailrace conditions. | Check whether the fish is aligned or swept sideways. |
| Orientation | Projected area factor | Cd factor | Best use | Watch-out |
|---|---|---|---|---|
| Head-on | 1.00 | 1.00 | Fish facing upstream, normal station holding. | Fins and open mouth can still raise drag. |
| Quartering | 1.75 | 1.25 | Angled fish in uneven river current. | Small angle changes cause a large load increase. |
| Broadside | 4.80 | 2.20 | Side sweep, net load, fish rolled in current. | Use body length x depth projection if needed. |
| Tail-first | 1.15 | 1.40 | Tired fish sliding downstream. | Wake separation increases effective Cd. |
| Rolling | 3.50 | 2.80 | Tumbling or uncontrolled fish in turbulent flow. | Output is a broad planning estimate. |
| Water condition | Density used | Viscosity cue | Drag effect | Practical interpretation |
|---|---|---|---|---|
| Warm freshwater | 995 kg/m^3 | Lower viscosity | Slightly lower force than cool water. | Common pond, lake, and summer river setting. |
| Cool freshwater | 999 kg/m^3 | Standard | Baseline freshwater estimate. | Good for trout streams and many river checks. |
| Brackish estuary | 1010 kg/m^3 | Moderate | Small force increase from density. | Use for tidal creeks and mixed salinity passes. |
| Saltwater | 1025 kg/m^3 | Standard marine | About 2-3 percent above freshwater. | Good default for inshore and offshore current. |
| Cold saltwater | 1028 kg/m^3 | Higher viscosity | Highest density case in this calculator. | Useful for deep, cold marine drifts. |
💡Calculation tips
Another common scenario is a fish hiding on side of a rock where there is current. How does it do that? Is it magic? No, it’s physics. The trout isn’t hanging magically suspended in space. Its muscles is fighting to hold position near an eddy of food. The water are pushing it downstream. That’s drag force, and knowing about drag will change your perception of what fish are doing in the water.
Speed isn’t everything. There’s also drag due to surface area exposed to flow, the shape of animal, and the flow rate itself. By inputting your variables into the calculator above, you can do the math without having to convert units manually or guess at coefficients. But the real value is knowing why those inputs matter.
Understanding Drag Force on Fish
The majority of folks believe that if you’re on a faster river, then there will be more drag. That’s true but it’s squared. Double the current speed and you’ll quadruple the force holding fish back. Water is dense and doesn’t give up its grip easy when an object tries to push through it.
Body shape affects resistance. Tuna have a torpedo shape which require them to cut through water without excessive resistance. Bass on the other hand are designed for brief acceleration and not long periods of cruising. So when you feed the tool the fish profile, you choose its water-moving properties.
How does the fish face the current? Is it facing it head on, is it going sideways? These will change how much resistance you face drasticly. If you take a trout and put it in a stationary position where it’s holding station against the current, it will use as little frontal area as possible so it can hold its load. Turn that same trout on its side. It’s now projecting a much larger surface area into the water, making it physically impossible to hold position within seconds. People tend to overlook this when considering a fish’s length but forget the area it fight against.
The other factor that also matters is water temperature. Cold water is thicker then warm water. This affects the Reynolds number, or prediction of how the object will behave during its movement. On the page there is a reference table regarding water viscosity and density. Notice that saltwater behaves different than cool freshwater. The difference may appear insignificant until you plug those numbers into the formula to determine amount of power needed by a salmon to swim through a fishway slot. More load means greater energy expenditure; the fish tire out quicker. And if the drag force become too much for the fish to handle, then it no longer holds position but begins to drift.
“Calculations are important but so is context. Chaotic eddies occur where there’s turbulence, such as behind dams and wakes of bridges. Those turbulent eddies adds drag that exceeds predictions made by smooth-flow formulas. Real world rivers aren’t always perfectly straight channels. Turbulent flow is included with its own adjustment factors in the tool. An Extreme label on the load rating typically denotes that the fish is surviving on burst speed alone. That’s the dividing line between stressed passage versus healthy habitat holding situations.
Because live things are in motion constantly changing their posture, no model will ever be perfect. Bodies stiffen with fatigue; fins spread as they fight; nets and tags artificialy increase the drag by adding unwanted surface area. Think of the calculator as a starting place for a plan, never as an absolute truth. It’s a way to help you understand what happens under the surface. It shows why certain currents seem harder to manage and why some locations has larger fish.
The next time you see one dive into the depths of darkness, consider how much unseen force is pressing on its mouth. They are working hard just to hold ground and double each other’s efforts with each slight increase in velocity. Knowing what drag does will help you understand why they are so picky about where they position themselves. It also explains why fighting them becomes difficult for both parties on opposite ends of the line.