Sonar Target Size To Fish Length Calculator
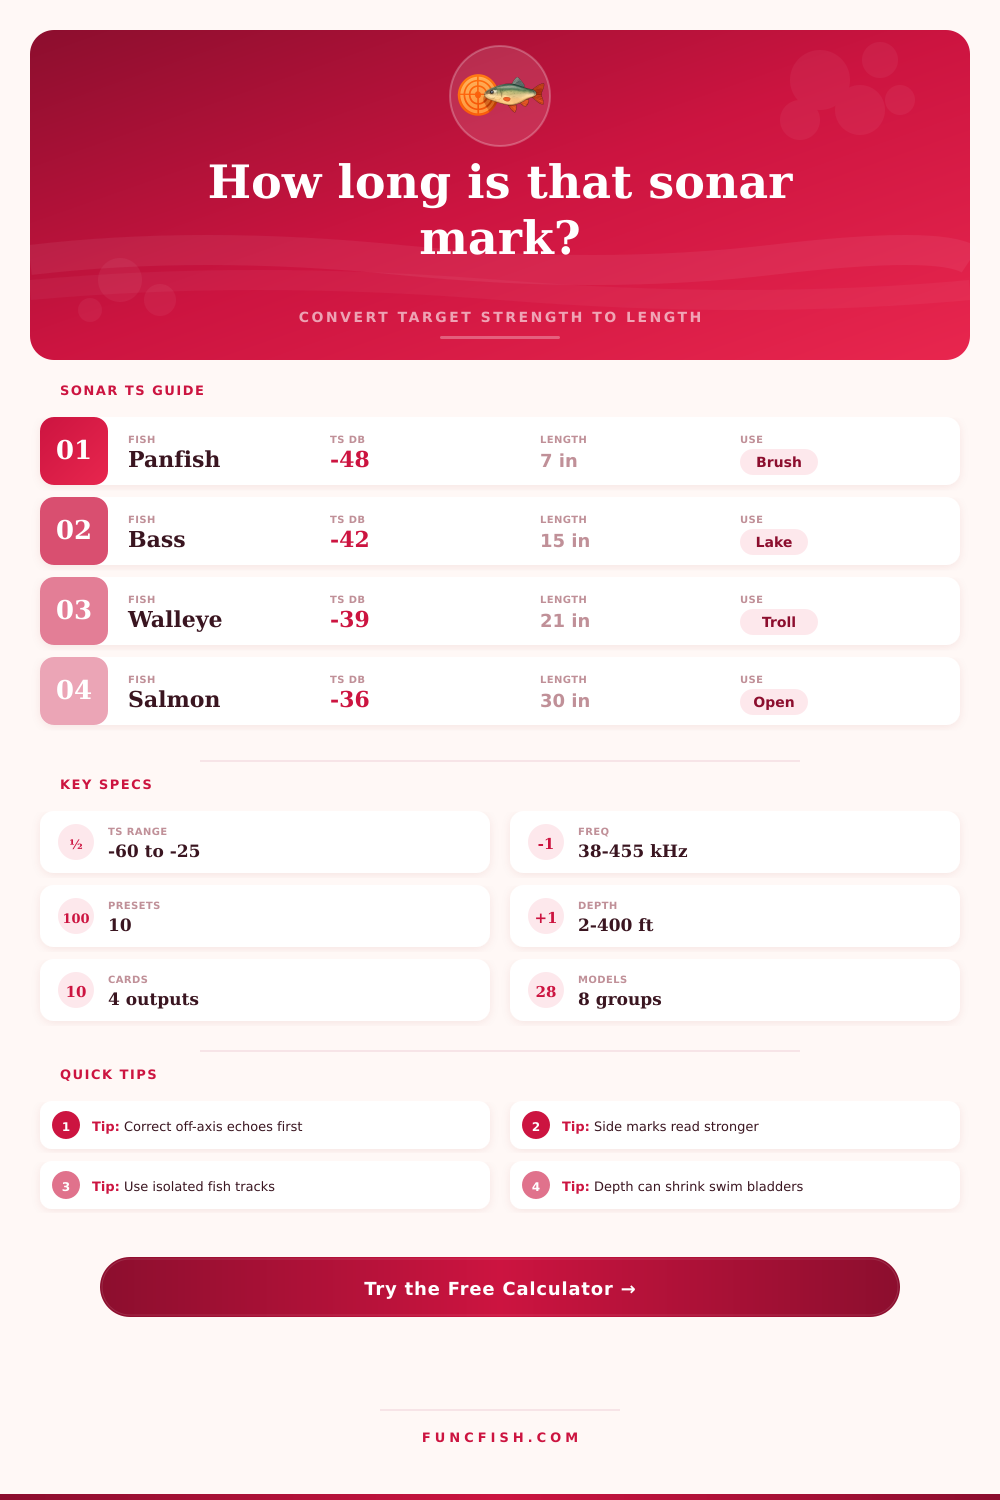
Estimate fish length from sonar target strength by applying species target-strength models, beam-offset correction, fish aspect, frequency, depth, and echo quality.
📌Sonar mark presets
⚙Target strength inputs
Estimated sonar length
Formula breakdown
📡Acoustic model snapshots
Common form for bass, walleye, trout, salmon, and shad-like targets.
Lower acoustic return for tuna-like fish with less gas reflection.
Typical correction for marks that are not centered in the cone.
Expected length spread after aspect, clutter, and calibration adjustments.
🎣Gear and species comparison grid
Best read with 200 kHz or down imaging in shallow to mid-depth lakes; brush and weeds widen the range.
Clean suspended arcs give the strongest length estimate; trolling passes often improve repeatability.
Small schooling fish can merge into one return, so use isolated edge marks rather than dense bait balls.
No-bladder targets need a different intercept; low-frequency offshore sounders are usually more stable.
📊Reference tables
| Species model | Formula form | Intercept used | Typical TS band | Calculator note |
|---|---|---|---|---|
| Bass, perch, or sunfish profile | TS = 20 log10(L cm) + b | -68.0 dB | -50 to -36 dB | Moderate swim bladder and broad sport-fish body |
| Walleye, zander, or sauger | TS = 20 log10(L cm) + b | -67.2 dB | -45 to -34 dB | Strong return when suspended and level |
| Trout, kokanee, or small salmonid | TS = 20 log10(L cm) + b | -67.8 dB | -48 to -35 dB | Works best with clear tracks away from bubbles |
| Large salmon or steelhead | TS = 20 log10(L cm) + b | -66.8 dB | -42 to -30 dB | Large fish can show strong aspect changes |
| Shad, herring, or alewife | TS = 20 log10(L cm) + b | -71.5 dB | -58 to -42 dB | School density can inflate apparent target size |
| Catfish or bullhead | TS = 20 log10(L cm) + b | -69.0 dB | -48 to -35 dB | Bottom returns and body angle need wider tolerance |
| Pike, muskie, or gar-like fish | TS = 19 log10(L cm) + b | -65.6 dB | -44 to -31 dB | Long body shape makes length more sensitive to aspect |
| Tuna, mackerel, or no-bladder pelagic | TS = 18 log10(L cm) + b | -72.0 dB | -46 to -28 dB | Lower gas reflection, so do not use freshwater bladdered formulas |
| Measured TS after correction | Bladdered fish length | No-bladder length | Common screen appearance | Interpretation |
|---|---|---|---|---|
| -56 dB | 5 to 7 in / 13 to 18 cm | 12 to 18 in / 30 to 46 cm | Tiny dot or weak speck | May be bait, small panfish, or partial cone hit |
| -48 dB | 10 to 13 in / 25 to 33 cm | 28 to 39 in / 71 to 99 cm | Short arch or bright point | Common bass, trout, crappie, or bait edge mark |
| -42 dB | 18 to 23 in / 46 to 58 cm | 55 to 75 in / 140 to 191 cm | Clear arc with strong center | Often a quality freshwater sport fish if isolated |
| -36 dB | 35 to 44 in / 89 to 112 cm | 115 to 150 in / 292 to 381 cm | Large bright mark | Large fish, multiple fish, or very favorable aspect |
| -30 dB | 68 to 84 in / 173 to 213 cm | 240 in+ / 610 cm+ | Heavy saturated return | Check for bottom, structure, bubbles, or grouped fish |
| Frequency band | Typical use | Strength effect used | Best target | Risk to length estimate |
|---|---|---|---|---|
| 38 kHz survey sounder | Deep water and pelagic marks | +0.6 dB correction | Large salmon, tuna, offshore schools | Coarse detail can merge close fish |
| 50 kHz conventional sonar | Deep freshwater or saltwater | +0.4 dB correction | Suspended large fish | Wide cone needs beam-position correction |
| 83 kHz wide cone | Search mode and broad coverage | +0.2 dB correction | Locating fish over structure | More off-axis marks than narrow beams |
| 120 kHz split-beam | Hydroacoustic survey work | 0.0 dB correction | Tracked single fish | Best only when calibrated and centered |
| 200 kHz fish finder | Common freshwater sonar | 0.0 dB correction | Bass, trout, walleye, panfish | Screen gain can be mistaken for TS |
| 455 kHz down imaging | High-detail shallow imaging | -0.7 dB correction | Structure edges and shallow fish | Aspect and fine beam geometry matter more |
| Echo condition | Uncertainty added | Reliability effect | Use this when | Estimator warning |
|---|---|---|---|---|
| Clean isolated fish track | 2% | Strong positive | Single fish is tracked for several pings | Best case for length conversion |
| Good single arch or dot | 6% | Positive | Mark is separated from clutter | Normal angler-screen estimate |
| Near bait or vegetation | 12% | Moderate | Target appears near small fish or cover | Bait can add energy to the return |
| Bottom-hugging target | 16% | Low | Fish is tight to lakebed or ledge | Bottom echo can inflate or mask TS |
| Possible multi-fish return | 24% | Very low | Several fish overlap in one cell | Length estimate may represent grouped biomass |
💡Calculation tips
There’s a big white streak on your sonar screen. Victory! Well, maybe not. What was that? Why do you have any doubts? Is that a big bass or panfish in the weeds?
The fact is most people view their sonar as a camera. Brighter = bigger. Not true. Sonar reflect sound back based off size, volume of the swim bladder and shape of the object (body). And how the fish is positioned to the transducer matter too. Understanding some basics of physics will help make sense of it all.
## How Sonar Really Works
After inputting your target strength information, the calculator does the rest of the work. There’s no need to remember logarithmic formulas for each species. But it’s good to know what you’re putting into equation.
Frequency makes a difference when considering coverage versus clarity. Lower frequencies such as 38 kilohertz can penetrates deep water. Meanwhile, 455 kilohertz high-frequency down imaging provide more definition in shallow depths. Do you want more clarity or more coverage? Depending on which direction you lean, that will alter the way sound wave interacts with the object. This changes the estimated length different than the frequency you choose.
Another error factor relates to beam offset. Because a fish on the outside of the cone fire its signal along a longer path and at a steeper angle, it loses energy along the way. It also loses some energy due to that steeper bounce angle. So if you don’t account for lost signal strength, you’ll size the perimeter marks smaller then they really are. A correction based on beam position compensate for that signal loss. It’s not much, just enough to make the difference between a keeper and releasing one. And the system do all this automatically. Raw becomes actionable.
Position can impact accuracy too. The signature of a fish looked at from top is not the same as when it’s seen head on or broadside. Looking from the top provide a good, solid profile. As a fish turns or tilts its signature scatters the sound in an inconsistent manner. Isolated tracks may be more easly interpreted than returns from schools. If several fish overlap, their echoes will blends together. This create the illusion that you’re looking at a big fish. Believe only your most clean marks. Cluttered marks require skepticism.
The third factor of added complexity… Especially for those with swim bladders (like bass)… Is depth. Deep water has more water pressure, which causes gas filled organs to be compressed; therefore they reflects sound less. An equal size bass will look bigger at 20-feet compared to a 100-foot mark. It look flatter because there is not as much bladder expansion on deeper marks. That biological compression are reflected in the model. This means that if you see deep water mark, it won’t look smaller than it actualy is. Most other basic guides fail to recognize this nuance. But it is critical to being able to size them accuratly.
Sonar is an instrument for estimation, not a tool for certainties. Sonar give us probabilities, not certainties. It’s about getting better odds, not perfect results. It accounts for environmental factors, species anatomy and beam geometry. Sonar gets you from guessing to knowing. It goes from mystery to a data point, and from a bright arc to something that makes sense.
When you start thinking of what we see on sonar as acoustic returns, things below the surface makes sense. Understanding what the machine tells you could of been the difference between catching dinner or missing out. Look past what you see on the screen.