Baitfish Abundance Estimator
Estimate forage abundance from cast-net, seine, light-trap, electrofishing, or sonar samples, then translate the survey into density, biomass, forage pressure, and confidence.
🏷Survey labels
📌Baitfish survey presets
⚙Sample and water inputs
Baitfish abundance estimate
Full breakdown
📊Comparison and species grid
Threadfin Shad
Shiners / Minnows
Bay Anchovy
Menhaden
📘Reference tables
| Survey method | Default sampled area | Base efficiency | Best use |
|---|---|---|---|
| Cast net throws | 150 sq ft / 13.9 m2 | 42% | Shad, mullet, menhaden, open shallow pods. |
| Beach seine hauls | 900 sq ft / 83.6 m2 | 58% | Minnows, juvenile sunfish, creek and shoreline forage. |
| Dip-net sweeps | 45 sq ft / 4.2 m2 | 30% | Rock pockets, grass holes, gobies, and microhabitat checks. |
| Light-trap hours | 220 sq ft / 20.4 m2 | 24% | Larval fish, smelt fry, night attraction samples. |
| Electrofishing minutes | 1200 sq ft / 111.5 m2 | 36% | Pond edges, coves, visible shoreline forage. |
| Sonar school marks | 5400 sq ft / 501.7 m2 | 68% | Open-water schools where marks represent pods. |
| Small trawl passes | 3600 sq ft / 334.5 m2 | 52% | Coastal bays, flats, and deeper soft-bottom lanes. |
| Visual school pods | 7200 sq ft / 668.9 m2 | 33% | Menhaden, mullet, surface shad, and bait sprays. |
| Baitfish group | Average size used | School behavior | Strong sample method |
|---|---|---|---|
| Threadfin shad | 2.5 in / 0.08 oz | Tight surface-to-midwater pods | Cast net and sonar. |
| Gizzard shad | 4.5 in / 0.55 oz | Looser schools, often bigger marks | Sonar, cast net, electrofishing. |
| Shiners and minnows | 2.2 in / 0.05 oz | Shoreline and current-seam schools | Seine, dip net, light trap. |
| Alewife or blueback herring | 3.5 in / 0.22 oz | Open-basin roaming schools | Sonar and trawl. |
| Bay anchovy | 1.8 in / 0.03 oz | Dense small-fish clouds | Trawl, light trap, sonar. |
| Menhaden or bunker | 4.0 in / 0.45 oz | Large visible filter-feeding pods | Visual, cast net, trawl. |
| Smelt | 3.0 in / 0.12 oz | Low-light and cold-water schools | Light trap, sonar, trawl. |
| Juvenile mullet | 3.2 in / 0.28 oz | Marsh-edge and mud-flat groups | Cast net, visual, seine. |
| Habitat profile | Modifier | Interpretation | Sampling note |
|---|---|---|---|
| Sparse cover or clean basin | 0.88 | Less edge refuge; schools may be spread thin. | Add open-water transects. |
| Light grass, docks, or riprap | 0.98 | Moderate edge concentration with usable lanes. | Split samples across cover and gaps. |
| Mixed cover and open lanes | 1.08 | Balanced forage habitat and predator access. | Good default for cove surveys. |
| Heavy grass, brush, or reefs | 1.18 | High refuge but lower catch efficiency. | Use seine or electro where possible. |
| Nursery marsh or flooded edge | 1.32 | Strong recruitment zone with small baitfish. | Expect clustered readings. |
| Corrected density | Abundance band | Predator signal | What to recheck |
|---|---|---|---|
| Under 1,000 baitfish/ac | Thin | Predators may roam or suspend. | Sample other arms or night edges. |
| 1,000-5,000 baitfish/ac | Moderate | Forage exists but may not hold fish everywhere. | Compare windy and calm banks. |
| 5,000-15,000 baitfish/ac | Strong | Predators often hold near edges of pods. | Track oxygen and water color shifts. |
| 15,000-40,000 baitfish/ac | Heavy | Lots of forage can scatter feeding windows. | Confirm with sonar or a second gear. |
| Over 40,000 baitfish/ac | Blooming | Very dense bait may mean recent hatch or stacking. | Repeat at more stations before scaling. |
💡Field tips
Sample design: Mix productive-looking stations with blank-looking stations. If every sample is thrown at a visible school, choose the hotspot coverage pattern so the estimate is scaled down.
Method check: Pair one catching method with one observing method when possible. A cast net tells you what can be caught; sonar or visual passes tell you how far the schools extend.
You throw the net, it falls to bottom in a circle, sinks beneath the surface and you start hauling it in. Eighteen threadfin shad. Not too bad of a morning. But what does it really tell you? It tells you a lot if you know how to read between the lines. Because those 18 fish could be remnants of a booming population or just a skimpy scatter that’s barely keeping the bass in the area. What you don’t see determine the answer. Before it’s a math problem, it’s an art form.
Once you plug in your conditions and effort, calculator takes over and turns your raw counts into density bands that make sense for your next trip. But what’s the effort? Here we get into defining work, and if you’re throwing a cast net, how much water do you effectively sweep with each throw? Most guidebooks estimate it is probably around 150 square feet. That area may be reduce if you’re throwing into dense vegetation, and increased when out in the open with lots of clarity. This is where you can tweak the area being sampled on the tool; and why it makes sense to do so: Density is only as good as the denominator you divide it by.
How to Count Fish in the Water
Over-estimating means your abundance appears sparse. If you under-estimate it, you will have a harvest plan that fits result. It is a little tweak but it is critical to anchoring the entire estimate.
It gets more complicated with habitat. A lake is not a uniform environment. Instead, fish concentrates on specific spots like nursery marshes, hide in edges of reefs, and spread out over open water. Modifiers for those profiles get fed into the estimator to account for how a school in a clear creek run differs from one hiding out in muddy backwater.
Where you’re searching matters; you need to inform the tool what it’s seeing. Sampling just the hotspot of birds diving won’t paint an accurate picture if you don’t choose a coverage pattern that adjusts for that bias. Even if it doesn’t seem as fun than running around chasing obvious action, randomized stations produce truer picture.
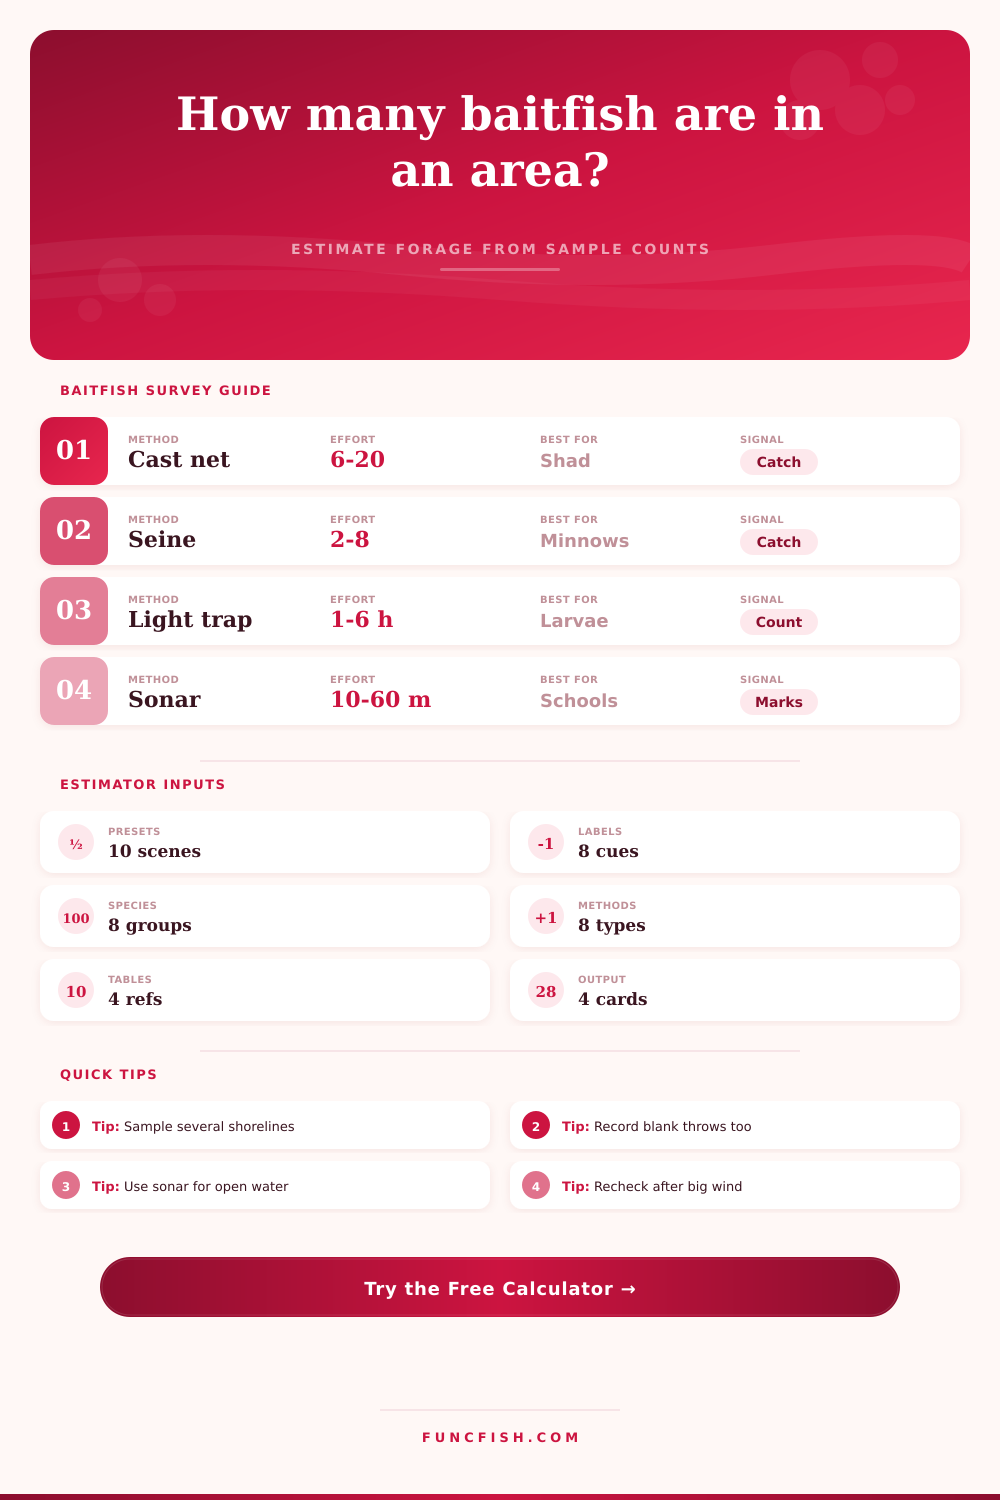
They also miss the fact that there is different efficiencies for methods as well. Because of how they are designed, one will pull up a larger swath of water and thus have different catch rates (a beach seine vs a dip net). Here’s how that looks on the page, with base efficiencies for each method (from electric fishing down to visual sonar marks). You’ll notice if you use an efficiency factor for your gear that doesn’t apply, it doesn’t work, it’s just like trying to measure something in feet with a ruler marked in inches.
This accounts for that, but you have to pick the right method for species. A cast net works great on shad; a seine is better at picking up minnow hanging out near the shore.
The last bit of context comes from season and predator pressure. Summer growth pulses aren’t the same as early spring holdover. It may be a bunch of bait but maybe they’re up there suspended over it and not actualy feeding on it. The estimator takes into account predator presence so you can interpret: Is the forage merely present or available? High levels of birds often show scattered bait that’s difficult to catch. Even though the biomass may be high, this reduce the effective yield.
It’s all about creating a mental map of the water. It’s more than counting fish. You’re trying to understand what’s going on with the ecosystem. When you get a density estimate that says heavy, you know to seek out those breaks in the schools on an edge. When you get a density estimate saying thin, maybe you’ll be looking for some sort of wind event to concentrate the forage. Your eyes will confirm what numbers are telling you. But they give you direction.
But baitfish estimation is less guessing and more understanding. Yes, throw the net back out if you want. But understand what it showed you in its initial attempt. That’s where this tool come in. It helps you turn that instant into something larger by showing how abundant they realy are. An accidental lucky catch becomes information you can rely on.
Take those blank throws into consideration next time you’re on the water. As much as full throws do, they tell you something too. And that’s when things become clear.