Fish Energy Density of Prey Calculator
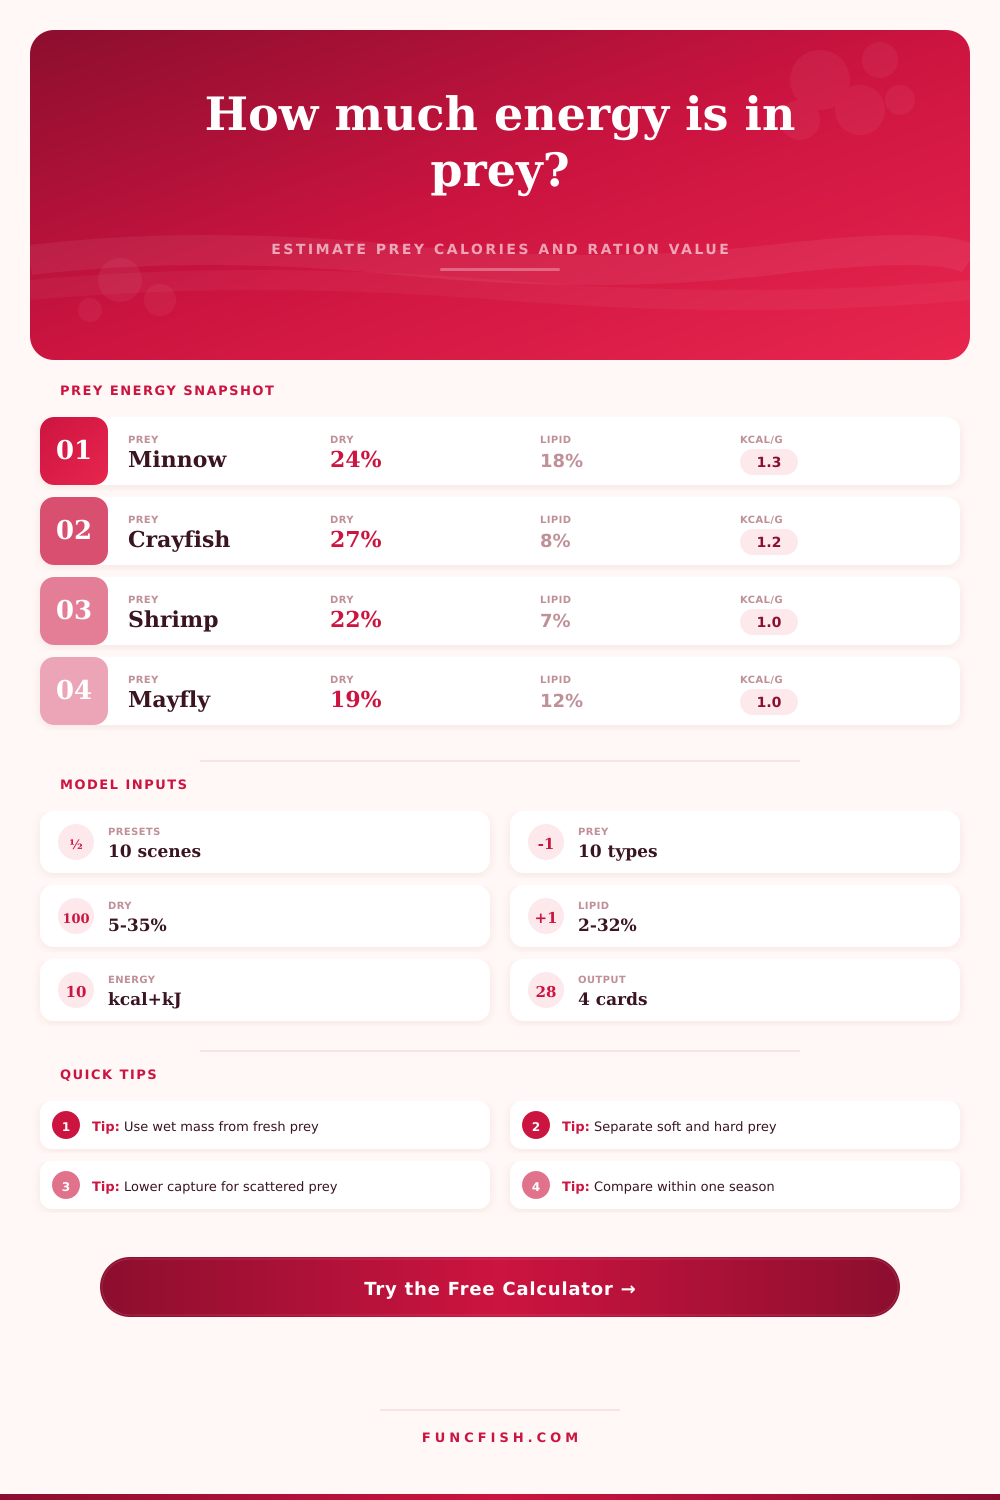
Estimate gross prey energy density, assimilated meal value, feeding-window calories, and ration coverage from prey type, wet mass, dry matter, lipid, protein, digestibility, capture success, predator size, and water temperature.
📌Prey energy presets
⚙Prey and feeding inputs
Prey energy density results
Formula breakdown
🐟Prey energy grid
📊Reference tables
| Proximate component | Energy coefficient | Where it applies | Calculator use |
|---|---|---|---|
| Lipid | 9.45 kcal/g dry | Oils, roe, fat stores | Raises prey energy density fastest |
| Protein | 5.65 kcal/g dry | Muscle and insect tissue | Main energy source in lean prey |
| Carbohydrate | 4.10 kcal/g dry | Glycogen and remaining organics | Computed after lipid, protein, and ash |
| Ash and shell | 0 kcal/g dry | Mineral, shell, bone, chitin | Lowers digestible energy share |
| Prey class | Wet energy band | Digestibility cue | Field note |
|---|---|---|---|
| Aquatic insects | 0.7-1.3 kcal/g | Moderate to high | Small but often abundant in drift or hatches |
| Crustaceans | 0.8-1.4 kcal/g | Shell dependent | Soft-shell stages can be much more profitable |
| Forage fish | 1.0-2.0 kcal/g | Usually high | Lipid-rich baitfish can dominate predator energy intake |
| Cephalopods | 0.8-1.4 kcal/g | High tissue yield | Good pelagic prey when capture rates are strong |
| Predator profile | Reference demand | Temperature behavior | Best comparison |
|---|
| Scenario preset | Prey | Predator | Energy signal |
|---|
💡Field checks
Tip: Treat the result as an energetic comparison tool. It is strongest when prey samples are weighed fresh and the same assumptions are used across sites.
Tip: Run separate estimates for soft-shell crayfish, egg-heavy baitfish, and lean post-spawn forage because moisture and lipid shifts can change meal value quickly.
A trout will lay there motionless for hours on end. You’ll be standing on the bank looking at it. The fish won’t seem to care about all the life swirling around it. But it’s calculating, laying there motionless. It’s waiting for an easy meal that are worth the energy spent to get it.
That’s the heart of foraging ecology. It’s not only about food but about profitable food. And when you begin to understand what makes that profit for them, you begin to see water differently. You begin to notice baitfish schooling and insects drifting by. You know why the predator won’t chase that easy snack right next to him but would chase down something more farther away or even smaller.
Understanding Fish Energy Choices
If you know what kind of prey and how they are fed, plugging those variables into the calculator above will do all math for you. You no longer need to do conversions or use coefficients. But that’s not as important than what goes into it. What does lipid content mean? What does wet mass mean? What does dry matter mean out there in the water column.
Chances are most folks think of a big shrimp as being a big meal. That isn’t necessarily true. Size is a trap. Sure, that big ol’ crayfish looks good, but if he’s got full of water and has an indigestible shell then his net energy yield could be less than that cluster of little fat rich mayflies. And that’s why you should of input lipid percentages and dry matter. This lets you adjust how you define what something is made off.
Of all the sources of energy available to a fish, lipid (fat) is by far the best. It has over twice as much energy per gram compared to carbohydrate and protein. That’s why predators key in on specific prey at times of year. If your baitfish are fat, predators rejoice. If they’re lean, well, predators gets their butt kicked a bit.
Metabolism makes all the difference. The tool lets you toggle between different predator profiles and water temperatures. A warmwater bass metabolizes food differently than a trout does in colder water. A trout may be starving in the spring when what a bass would love is something it cannot eat. The page has a reference table that breaks it down. It shows how various species deals with energy demand under varying circumstances.
Hunting isn’t always an efficient business. Not all strikes turn into meals. Hunger levels affect strike rates, as does habitat. For instance, a fish that’s pursuing prey around cover like vegetation or rocks has lower chances of success compared to a fish hunting for prey in more open water. This calculator factors in a percentage chance of capturing prey. Now, if you’re finding that your strike rate is poor, then the potential energy goes way down (even if the prey itself contains a lot of nutrients).
That’s where folks mess up. They think about how good the prey is without considering how hard it was to catch. You can have prey with really high energy density but if you miss the opportunity, you simply lose out.
The season also matters heavily. For instance, prey items will have different chemistry due to age (mature vs. Immature), size, or life stage (such as spawning or growing). What about a spawning versus a post-spawn prey item? That’s going to be a differnt level of nutrition for a hungry predator. Change that in the tool and observe effect on ration coverage relative to life stage. Small details matter. A fish eating lean, spent prey has to eat more frequently to maintain weight. That change in behavior influences how aggressive or selective it is.
So that’s what this tool is. A lens. It is a lens through which you can go from guessing to understanding how the fishery works economically. No longer are you just looking at fish. You’re looking at energy budgets. The next time you see a fish turn down an offering right in front of them, you might understand they aren’t necessarily being picky; they’re simply being efficient. There are so many choices in the water and the fish have done the math.