Fish Foraging Efficiency Calculator
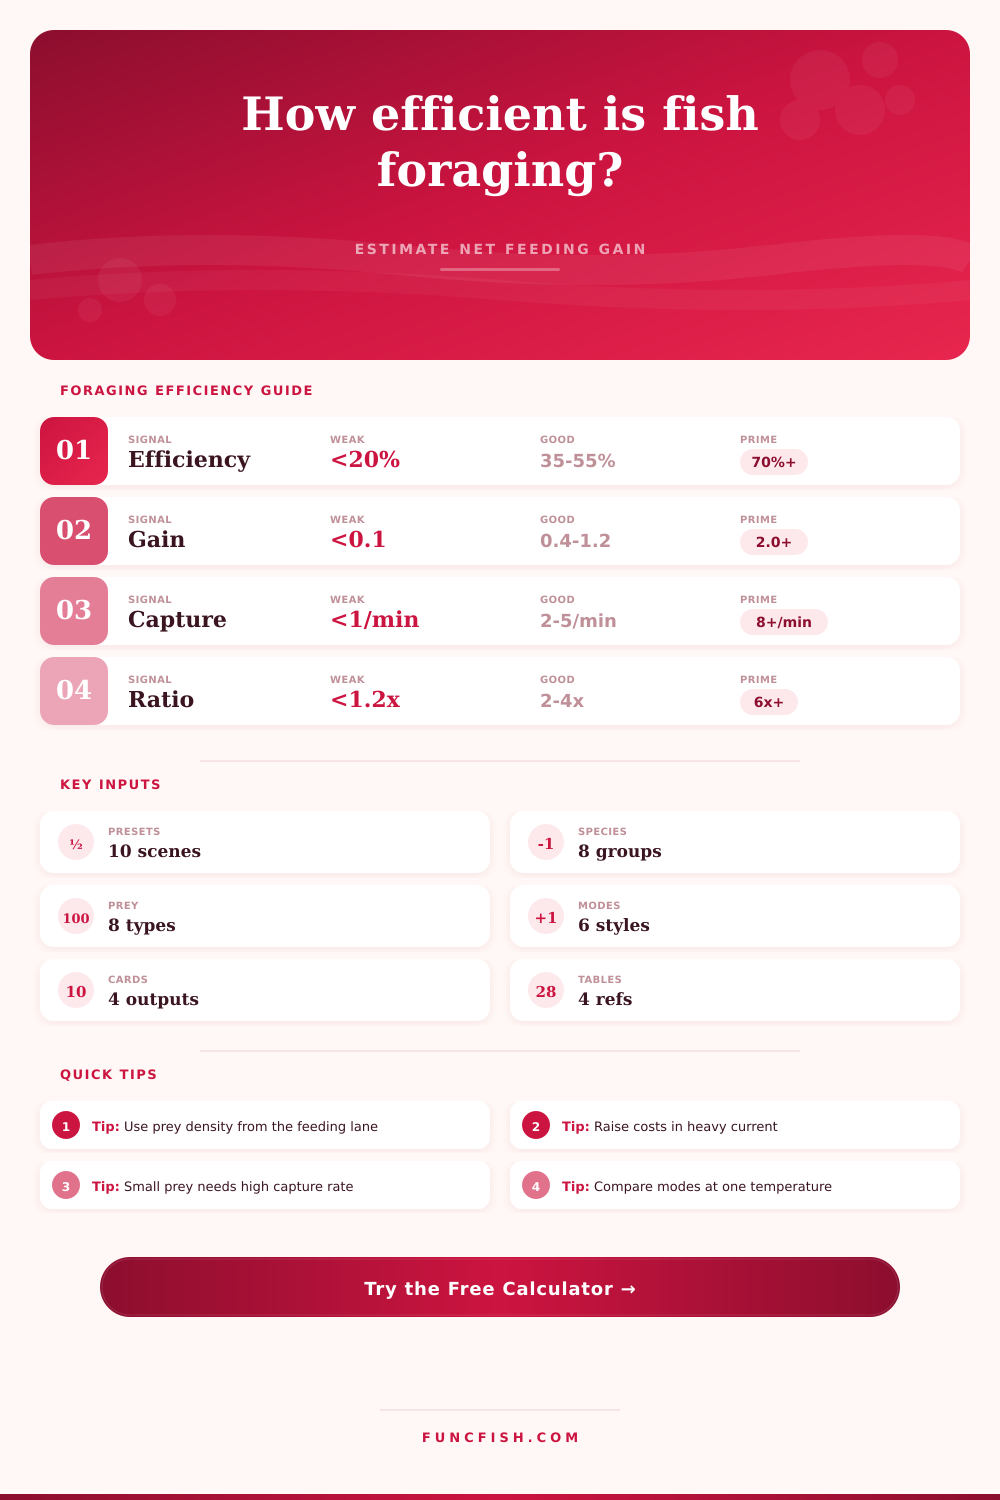
Estimate whether a fish gains useful net energy from a feeding lane by balancing prey energy, encounter rate, capture success, handling time, swimming cost, temperature, visibility, and competition.
🏷Foraging labels
📌Foraging presets
⚙Fish, prey, and water inputs
The calculator treats foraging as energy intake from captured prey minus swimming, search, strike, handling, temperature, and competition costs. It is best for comparing scenarios rather than declaring a biological absolute.
Foraging efficiency estimate
Calculation breakdown
🧮Foraging factor grid
Prey Energy
Capture Success
Water Speed
Efficiency Band
📊Reference tables
| Species group | Best prey signal | Preferred window | Cost sensitivity | Calculator note |
|---|---|---|---|---|
| Trout / char | Aquatic insects and small fish | Cool, oxygenated current | High in fast lanes | Strike range and current speed strongly affect net gain. |
| Black bass | Minnows, shad, crayfish | Edges, cover, and ambush lanes | Moderate burst cost | Ambush positions can reduce swimming cost. |
| Walleye / sauger | Minnows and shad | Low light and moderate current | Moderate | Visibility can improve capture at dusk or stain. |
| Panfish | Midges, small larvae, tiny fish | Vegetation, docks, and soft edges | Low but prey energy is small | High capture rate is needed for strong efficiency. |
| Catfish | Crayfish, worms, benthic prey | Bottom scent and contact zones | Low cruise cost | Handling time matters for large hard prey. |
| Pike / muskie | Large fish prey | Ambush cover and weed edges | High burst cost | Few captures can be efficient when prey is large. |
| Striped bass | Schooling shad and herring | Open water schools | High cruise and chase cost | Schooling prey can offset high activity costs. |
| Carp / sucker | Worms, grubs, soft benthos | Bottom feeding lanes | Low | Efficiency rises when handling time stays short. |
| Prey item | Typical energy | Default mass | Handling load | Useful interpretation |
|---|---|---|---|---|
| Midges or tiny larvae | 4.2 kJ/g | 0.01 g / 0.0004 oz | Very low | Efficient only when density and capture rate are high. |
| Mayfly or caddis nymphs | 5.0 kJ/g | 0.25 g / 0.009 oz | Low | Good drift prey for medium fish in current. |
| Small minnows | 5.7 kJ/g | 2.5 g / 0.088 oz | Moderate | Strong energy return when capture success stays above average. |
| Shad or herring fry | 6.3 kJ/g | 4.5 g / 0.159 oz | Moderate | School density can produce prime feeding ratios. |
| Shrimp or scuds | 4.8 kJ/g | 0.8 g / 0.028 oz | Low | Reliable mid-energy prey around grass and flats. |
| Crayfish | 4.5 kJ/g | 8.0 g / 0.282 oz | High | Large energy package, but hard parts raise handling cost. |
| Worms or grubs | 4.0 kJ/g | 1.2 g / 0.042 oz | Low | Bottom feeders benefit from low search and chase cost. |
| Eggs or soft pellets | 6.8 kJ/g | 0.08 g / 0.003 oz | Very low | Small prey can still score well when drift is dense. |
| Foraging mode | Encounter path | Energy cost | Best use | Efficiency risk |
|---|---|---|---|---|
| Drift feeding lane | Water carries prey through strike window | Holding cost rises with current | Trout, salmonids, panfish near flow | Fast water can outpace prey intake. |
| Ambush edge strike | Short burst from cover or seam | Low search, brief chase | Bass, pike, redfish on edges | Low prey density creates long waiting gaps. |
| Cruising open water | Fish sweeps a moving search volume | Continuous swimming cost | Walleye, stripers, roaming predators | Clear water and density matter most. |
| Benthic picking | Prey found along bottom area | Low movement, more handling | Catfish, carp, panfish | Hard prey can slow intake. |
| Surface sipping | Surface film prey inside rise window | Low swimming, picky capture | Trout, panfish, calm-water feeders | Small prey mass limits net gain. |
| School-chasing burst | Dense bait schools create pulses | High burst and chase cost | Stripers, bass, pike | Efficiency drops fast if school density fades. |
| Temperature relation | Effect on appetite | Effect on cost | Typical signal | Calculator behavior |
|---|---|---|---|---|
| Below preferred range | Lower pursuit and digestion | Lower base metabolism | Short feeding windows | Capture and appetite are reduced. |
| Near preferred range | High willingness to feed | Manageable activity cost | Best efficiency window | Temperature modifier stays near 1.00. |
| Above preferred range | Often selective or stressed | Higher oxygen demand | Efficiency can fall | Metabolic cost multiplier increases. |
| Warm with low visibility | Species dependent | Higher search cost | Ambush may beat cruising | Visibility and mode multipliers separate the scenarios. |
💡Calculation tips
Tip: Keep prey density tied to the fish's actual feeding lane. A whole-cove bait estimate can overstate efficiency for a fish pinned to one edge.
Tip: Recalculate after changing only one variable, such as current speed or prey size. The clean comparison shows whether the fish gains more from position or prey quality.
It’s easy for anglers to think that if there is a fish there, there will be a good bite, but being there and feeding are two different things. Just because a trout is sitting in a seam for an hour doesn’t mean it’s eating. It could be burning more energy trying to stay put than it’s getting from the occasional piece of food cruising past.
Net energy gain often decide the difference between frustration and a productive day. It means was the prey worth the chase or just there.
The Fish Energy Balance
First thing: What’s the prey like? A tiny midge has almost no energy per unit, so it only make sense for a fish to feed if it can capture many units. On the other hand, a larger crayfish provides a dense package of energy, but its harder shell increase handling time, slowing the overall intake rate. This calculator on the page will do that math for you, just enter an estimate of both the prey mass and density, saving you from guessing which factor dominates the equation.
Big prey is fast; small prey is voluminous. Regardless of size of the meal, efficiency drops when handling time lingers.
The cost of doing business increases as the water temperature increase. In cold water, the fish are metabolically slow and can affords to be more choosy and even forage for less than prime meals. Why expend calories pursuing something tiny and hard to see when you have such low baseline energy costs? As the water warms, metabolic cost increases. Perhaps there is no reason to chase those tiny insects anymore because the calories burned while chasing them does not match the calories gained from the meal. That’s why peak efficiency tends to occur within a very tight band of temperatures. The fish just can’t justify the cost of eating outside this range.
Habitat structure and visibility determine where you’ll have your best strike percentage: In clear water, a fish sees farther. It also has more visual distractions and may spook shy prey. So it’s easier for a bass to sit off an edge (see ref table) then a walleye crusing a lane of coverless, light-dappled water.
In turbid water, a fish is forced to react to vibration and closeness. That makes for ambush opportunities versus cruising. Current-breaking cover such as vegetation or rock cuts down on the swimmer’s energy expenditure and gives him time to rest between meal.
Bait choice is half the equation; position is the other half. There’s also a hidden factor of competition pressure. When one fish has a feeding lane, he picks off the best stuff and ignores the rest. Throw a school of competitors into that equation and quality of prey decreases for each individual. Their intake rate remains high, but the energy density of each item diminish. That swings the balance back toward quantity versus quality.
This happens frequently during spawning runs as fish must eat anything they can get their gills around just to maintain pace with the crowd.
Take these numbers with a grain of salt. They’re not gospel (nature isn’t perfect), after all, and we will never build an exact model that includes every detail of a changing environment. It’s simply to get a feel for why a location was productive yesterday and not today. You should of used it more often. Did the current pick up? Was the holding cost affected? Did water clarity change and effectively shrink strike zone? If you eliminate variables one at a time, you can identify which disrupted the equation.
So there’s your equation, ultimately it’s a budget on foraging efficiency. The fish has only so much he can invest before he begins to lose ground in terms of his search, movement and handling. If the intake outweighs the cost, we see aggressive, visible feeding activity. If the cost outweighs the intake, the fish become quiet. It waits. It sits.
This understanding of the tradeoff will help you begin to find where the energy balance naturaly tips in the fish’s favor, and that’s what leads to consistent catches.