Fish Comfort Zone Overlap Calculator
Score how closely a spot overlaps a target species comfort range using temperature, dissolved oxygen, pH, depth, visibility, current, habitat, and presentation fit.
📌Comfort scenario presets
⚙Water and presentation inputs
Comfort overlap forecast
Formula breakdown
📋Gear and species comparison grid
Bass Weed Edge
Trout Current
Walleye Break
Catfish Bend
📐Species comfort ranges
| Species | Comfort temperature | Minimum oxygen | Typical depth | Flow preference |
|---|---|---|---|---|
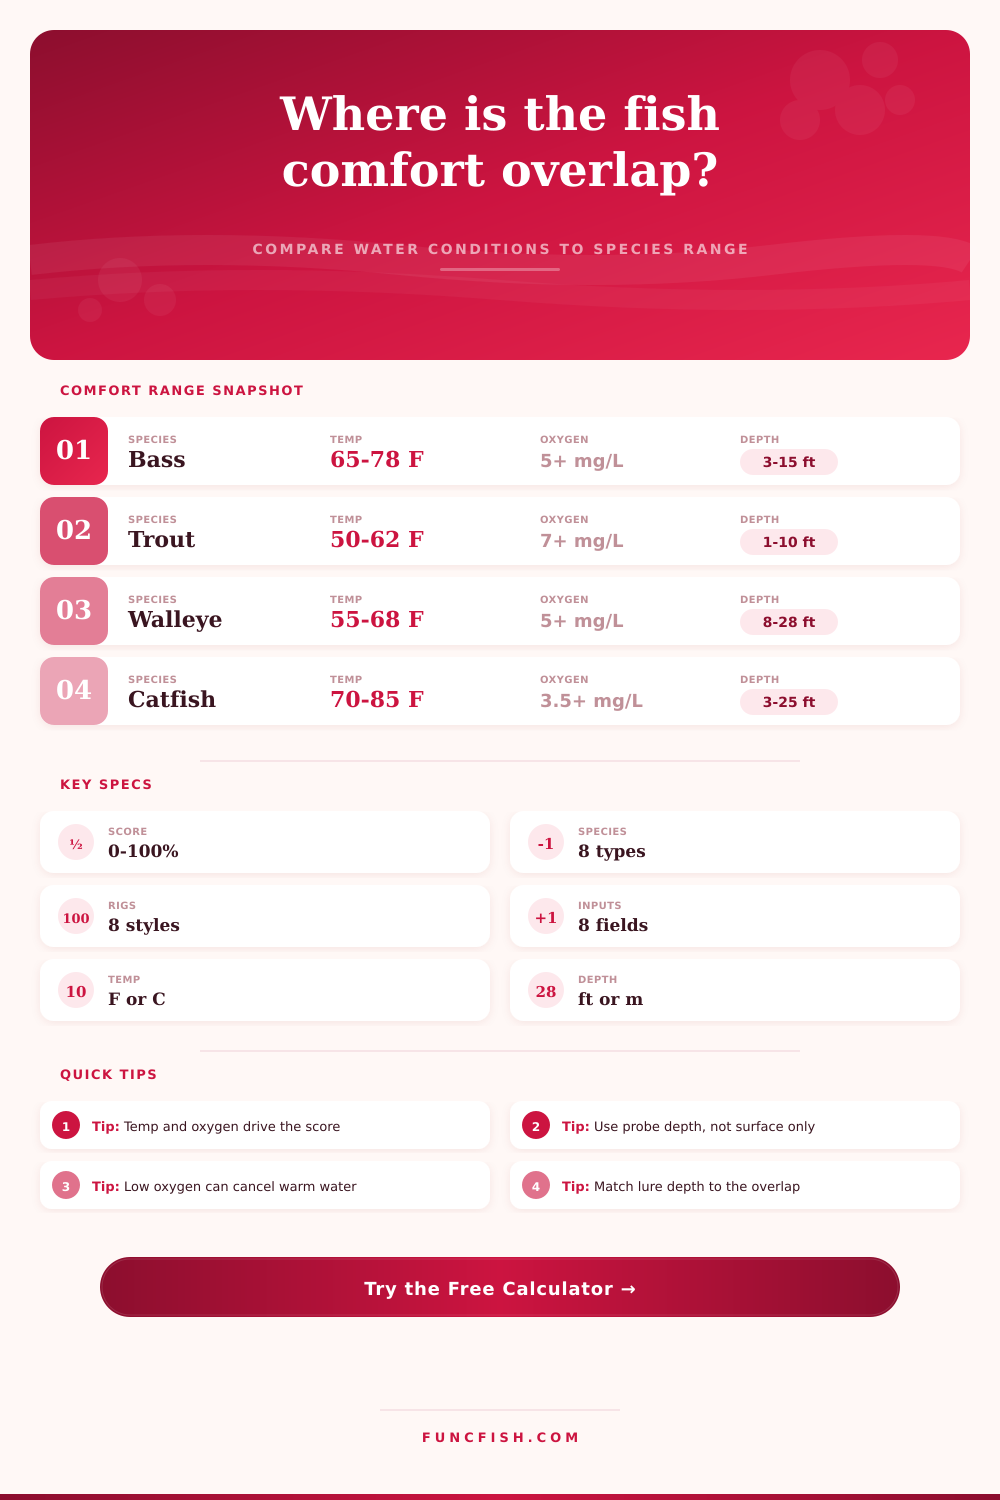
| Largemouth bass | 65-78 F / 18-26 C | 5 mg/L | 3-15 ft / 0.9-4.6 m | Still to light |
| Smallmouth bass | 60-72 F / 16-22 C | 6 mg/L | 4-20 ft / 1.2-6.1 m | Light to moderate |
| Rainbow trout | 50-62 F / 10-17 C | 7 mg/L | 1-10 ft / 0.3-3.0 m | Moderate to fast |
| Walleye | 55-68 F / 13-20 C | 5 mg/L | 8-28 ft / 2.4-8.5 m | Light to moderate |
| Channel catfish | 70-85 F / 21-29 C | 3.5 mg/L | 3-25 ft / 0.9-7.6 m | Slow to moderate |
| Northern pike | 55-68 F / 13-20 C | 5 mg/L | 3-15 ft / 0.9-4.6 m | Still to light |
| Striped bass | 58-72 F / 14-22 C | 5.5 mg/L | 10-45 ft / 3.0-13.7 m | Light to fast |
| Crappie | 60-75 F / 16-24 C | 5 mg/L | 4-18 ft / 1.2-5.5 m | Still to light |
| Coho salmon | 45-58 F / 7-14 C | 7 mg/L | 2-20 ft / 0.6-6.1 m | Moderate to fast |
| Redfish | 70-85 F / 21-29 C | 4 mg/L | 1-6 ft / 0.3-1.8 m | Still to moderate |
🌡Water chemistry scoring table
| Measured factor | Strong overlap | Edge overlap | Low overlap | Calculator weighting |
|---|---|---|---|---|
| Temperature | Inside species band | Within 5 F outside | More than 10 F outside | 25 percent |
| Dissolved oxygen | At ideal target | Near minimum | Below minimum | 20 percent |
| pH | Inside species band | Within 0.4 outside | Beyond tolerance shoulder | 12 percent |
| Visibility | Inside clarity band | Slightly clearer or muddier | Far outside band | 10 percent |
🎣Presentation match reference
| Presentation | Depth window | Visibility window | Current window | Best overlap use |
|---|---|---|---|---|
| Finesse jig | 2-20 ft / 0.6-6.1 m | 12-72 in / 30-183 cm | 0-1.2 ft/s | Bass, crappie, walleye |
| Suspending jerkbait | 3-12 ft / 0.9-3.7 m | 18-96 in / 46-244 cm | 0-0.8 ft/s | Clear, cool edges |
| Medium-diving crankbait | 6-14 ft / 1.8-4.3 m | 8-60 in / 20-152 cm | 0-1.5 ft/s | Breaklines and flats |
| Bottom bait rig | 4-40 ft / 1.2-12.2 m | 2-48 in / 5-122 cm | 0-2.0 ft/s | Catfish and baitfish zones |
| Live bait float rig | 1-12 ft / 0.3-3.7 m | 6-84 in / 15-213 cm | 0-1.8 ft/s | Controlled suspended baits |
| Trolling spoon | 10-60 ft / 3.0-18.3 m | 12-120 in / 30-305 cm | 0.3-3.0 ft/s | Open-water layers |
| Topwater plug | 0-3 ft / 0-0.9 m | 8-72 in / 20-183 cm | 0-0.8 ft/s | Warm active surface fish |
| Weighted fly nymph | 1-8 ft / 0.3-2.4 m | 12-96 in / 30-244 cm | 0.5-3.5 ft/s | Trout and salmon current |
🌊Habitat adjustment table
| Habitat type | Overlap bonus species | Common limiting factor | Best measurement point | Multiplier range |
|---|---|---|---|---|
| Vegetation edge | Bass, pike, redfish | Night oxygen drop | Outside weed face | 0.88-1.06 |
| Rock flat | Smallmouth, walleye | Bright clear water | Windward edge | 0.90-1.05 |
| Tailwater current | Trout, salmon | Too much current | Seam-side holding lane | 0.82-1.08 |
| Channel bend | Catfish, striped bass | Low oxygen pockets | Inside edge and drop | 0.86-1.05 |
| Thermocline layer | Walleye, striped bass | Oxygen below layer | Above oxygen break | 0.80-1.08 |
| Brush or timber | Crappie, largemouth | Snaggy depth bias | Top and outside limbs | 0.88-1.05 |
| Grass flat | Redfish, bass | Hot shallow water | Moving tide lane | 0.86-1.07 |
| Open water | Striped bass, salmon | Scattered fish layer | Bait depth on sonar | 0.84-1.04 |
💡Calculation checks
Tip: Use measurements taken at the lure or bait depth whenever possible. Surface temperature can overstate comfort when oxygen falls below the thermocline.
Tip: When the overall overlap is strong but the presentation score is weak, change running depth or lure style before abandoning the spot.
So what happens when you see a spot on paper that should be good… but it’s getting no love from the fish? You have the right time of day. Bait is there. Structure are present. But man, its dead water.
Your presentation isn’t the issue most times; it’s usually the fish comfort zone. Because fish are cold blooded, they’re constantly trying to be efficient with their energy. That means they won’t sit in water that costs them to much energy to breathe or process.
Why Fish Don’t Bite
Enter this calculator. It take real-time water data and compares it to limits for specific species. And here’s the kicker: It weighs all those factors into a single score; taking the guesswork out of location scouting. It turns your hunch into something measurable.
It’s all about the heat, but it’s also about more than just the heat A lot of folks will just take a reading from the surface, figure it’s the same throughout the entire column and go fishing. That is an expensive lesson. A lot of times, fish is connected to a certain thermocline layer or holding closer to bottom. In the summertime when we’re after bass, they can absorbs in cooler water under a warm top layer.
When you punch that lower, cool water number into device, it totally alters your score. To make it even more effective, the calculator give a lot of weight to the temp. It can be as much as twenty-five percent of overall total. This forces us to consider where the fish really exist rather than simple where sunlight penetrates the water.
The silent killer for a great day of fishing is dissolved oxygen. Cold water holds more oxygen then warm water. Above seventy-five degrees oxygen will often plummet to a level that makes fish lethargic. Seventy-five degrees may be a largemouth bass’ dream temperature, but with only four milligrams per liter of oxygen in the water, it’s not so sweet. The tool automatically takes this tradeoff into account. If the oxygen level are poor but the other thermal conditions is ideal, the overall comfort score will suffer greatly. You won’t waste your time on a spot that appears inviting due to thermal conditions, but is biologically inhospitable.
Current and Depth: Both current and depth provide stability. A fish in a clear lake in shallow water with no cover isn’t safe. A fish on the bottom in a deep channel with moderate current has it made. The selected depth is compared to depth range each species prefers. In the summer, walleyes likes deep structure which can be anywhere from ten to twenty feet or more. Spring crappies favor shallower brush pile in the spring. A depth that falls outside the comfort band will result in a mismatch reflected in the score. It’s not simply catchability. Its about whether the fish are comfortable enough to bite.
The last variable is presentation fit. In slow moving, clear water, a finesse jig fits that bill. In dirty water running fast, it doesn’t. The tool integrates your lure selection with speed and clarity of the water. You can have a topwater plug in dirty water and not have much of an overlap score because fish won’t get a good look at your bait. They just don’t react to something they can’t see. That’s where this equation comes into play. It keeps you from selecting wrong tool for the job.
What do all those numbers mean? These scores come from the reference tables on this page, which indicate best depth range, oxygen level, and temperature range for 10 popular fish species. For example, notice how catfish require far less oxygen than trout. Trout are sensitive; catfish is hardy and will tolerate lower levels of oxygen. Their biology determines where you find them.
The habitat adjustment factors helps as well. In summer, for instance, fishing a weed edge may increase your score versus open water due to the cover and shade provided by vegetation.
This method alters your lake scouting process. No longer are we casting bait to anything that looks good. First we gauge the situation. What’s the temperature? How deep is it? How clear is it? How much oxygen do I have? Where is the match? We fish with confidence when the numbers matches. Otherwise we go elsewhere.
There’s no lying in the water. And there’s never any faking the math either. It eliminates frustration and time wasted. You should of checked the data first.