Species Coexistence Temp Overlap Calculator
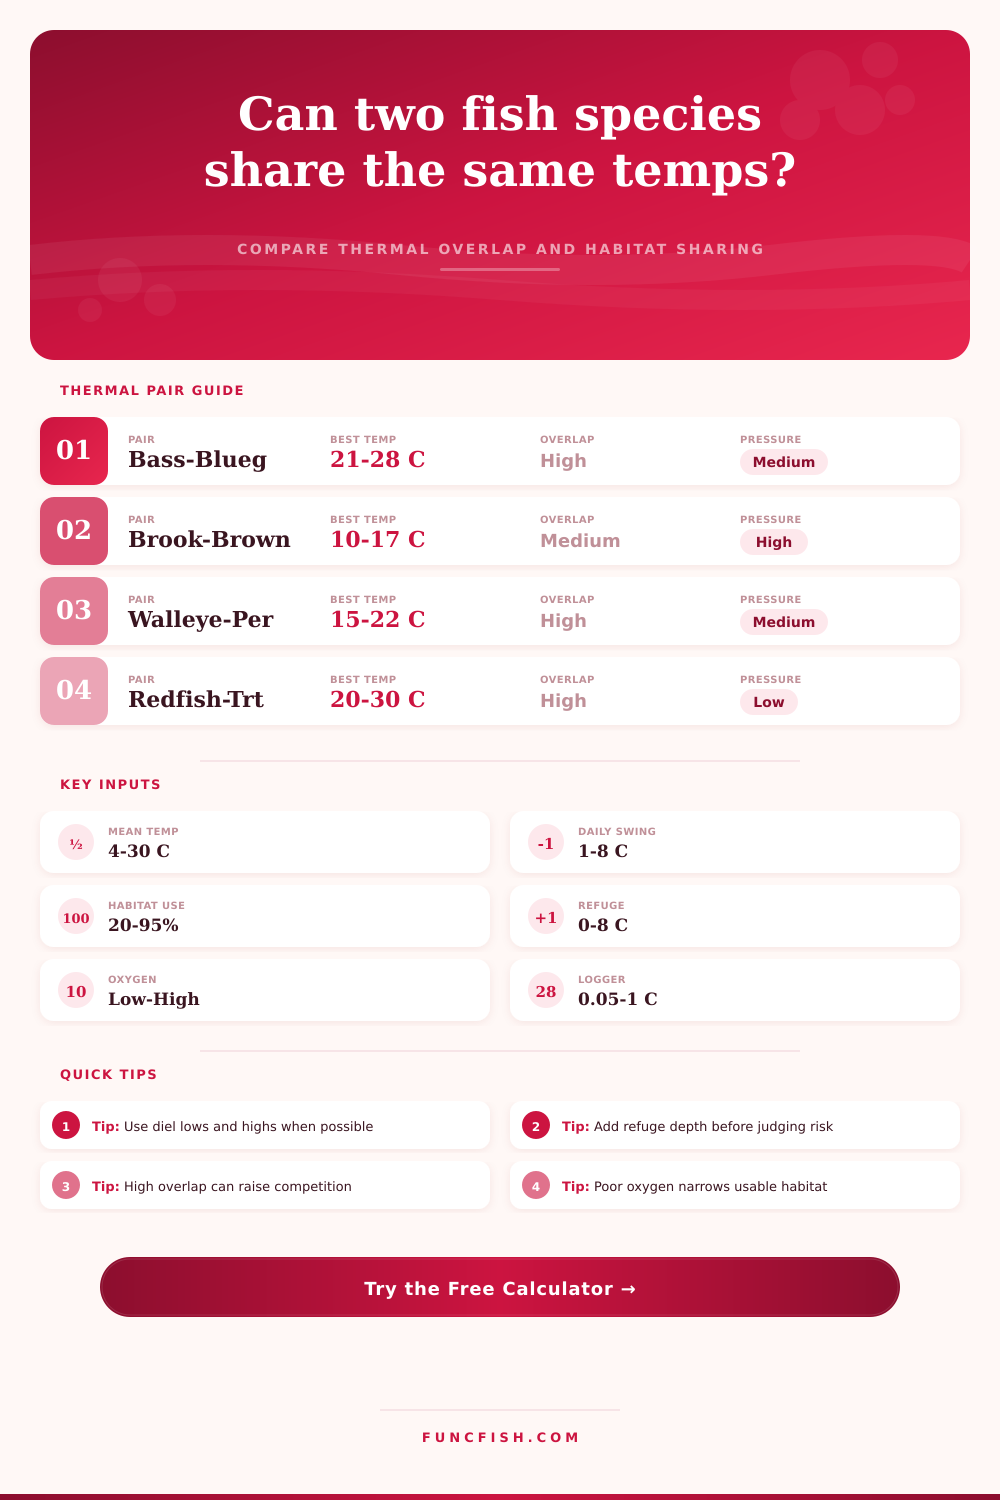
Estimate whether two fish species can share the same thermal space by comparing preferred ranges, measured water swings, refuges, oxygen stress, and habitat overlap.
📌Field presets
⚙Thermal overlap inputs
Coexistence temperature results
Formula breakdown
📊Gear and species comparison grid
Largemouth
Brook trout
Bottom logger
Meter probe
📋Reference tables
| Species | Preferred temperature | Broad tolerance | Habitat note |
|---|---|---|---|
| Brook trout | 10-16°C / 50-61°F | 2-20°C / 36-68°F | Cold runs, high oxygen |
| Brown trout | 12-18°C / 54-64°F | 3-24°C / 37-75°F | Cool pools and riffles |
| Walleye | 15-22°C / 59-72°F | 4-28°C / 39-82°F | Cool edges, low light |
| Yellow perch | 17-23°C / 63-73°F | 5-29°C / 41-84°F | Weed edges and flats |
| Largemouth bass | 24-30°C / 75-86°F | 10-36°C / 50-97°F | Warm cover and littoral zones |
| Channel catfish | 24-30°C / 75-86°F | 5-35°C / 41-95°F | Warm river holes |
| Season pattern | Typical swing | Refuge value | Overlap meaning |
|---|---|---|---|
| Spring lake transition | 2-4°C / 4-7°F | Moderate | Many cool and warm species mix |
| Summer stratified pond | 3-7°C / 5-13°F | High | Refuges separate stress windows |
| Cold spring creek | 1-3°C / 2-5°F | Low | Small changes matter for trout |
| Tidal marsh flat | 4-8°C / 7-14°F | Moderate | Diel timing shifts overlap fast |
| Warm lowland river | 2-6°C / 4-11°F | Moderate | Oxygen can limit warm tolerance |
| Data source | Accuracy band | Sampling strength | Best use |
|---|---|---|---|
| Handheld spot thermometer | ±0.5°C / ±0.9°F | Low | Quick bank or boat checks |
| Floating temperature logger | ±0.2°C / ±0.4°F | High | Surface diel tracking |
| Bottom-mounted logger | ±0.2°C / ±0.4°F | High | Refuge and thermocline checks |
| Sonar temperature probe | ±0.7°C / ±1.3°F | Medium | Mobile depth passes |
| Multiparameter meter | ±0.1°C / ±0.2°F | High | Temperature plus oxygen work |
| Station or buoy data | ±0.3°C / ±0.5°F | High | Broad waterbody context |
| Overlap index | Coexistence read | Competition read | Field check |
|---|---|---|---|
| 0-25% | Separated by temperature | Usually low | Look for different depth bands |
| 26-50% | Partial seasonal mixing | Low to medium | Confirm dawn and afternoon temps |
| 51-75% | Strong shared window | Medium | Check cover and prey partitioning |
| 76-100% | Broad thermal coexistence | Medium to high | Watch oxygen and refuge compression |
💡Calculation checks
Tip: Treat the overlap score as a field screening value. A high temperature overlap means both species can use the same thermal band, but cover, prey, oxygen, and life stage still decide how tightly they share it.
Tip: Use a bottom logger or multiparameter meter when refuge differences drive the result. Surface readings alone can miss colder pockets that allow coexistence during warm afternoons.
Mid-summer; it’s July and you’re standing on shore of a small impoundment. It’s calm and the water feels warm underfoot. Could that pond have bluegill and largemouth bass competing over thermal real estate? Or maybe they just don’t care about each other as one seeks out open water while the other conceals itself in the vegetation.
Turns out temperature doesn’t explain everything when it comes to coexisting species. While it helps set the stage, other things like daily thermal swings, habitat structure, and oxygen levels really decides the outcome.
How Fish Share Water
Once you measure the conditions and enter your favorit ranges into the calculator above, it will do the math for you. No more need to guess at conversions or coefficients. It’s pretty straightforward at its core.
Each species of fish has there own thermal comfort zone. An area where they can reproduces effectively and feed well. Two such species which have identical comfort zones will compete more with each other. They’re fighting for the same energy budget.
But guess what? Nature doesn’t allow them to be mixed evenly. Perhaps one backs off into deeper, cooler water in the afternoon when it get hot. Maybe the other holds tight to shade on the bank.
That’s where this tool helps. It measures that separation. It takes the raw temperature overlap and factors in how much of habitat is accessible to both species. Even if the temperatures line up perfectly, the amount of habitat share can reduce the competition pressure.
The quality of your data is important. A handheld thermometer provides one point in time (a snapshot). That may be fine for a casual check. For understanding diel patterns, though, you need something that provides continuous data. For that, you need a bottom-mounted sensor or a floating logger. Then you see the swing of the day.
Temperature in a shallow pond can change several degrees from dawn to noon. That daily swing results in temporary refuges. If a brook trout has access to a cold spring run, it might be able to tolerate a warm afternoon. Without that refuge, the same temperature would cause lethal stress.
This is laid out on the page in the reference table. The table show how different kinds of data vary in sampling strength and accuracy.
Take the oxygen variable for example. Dissolved oxygen decreases as water warms. It’s simple physics that translates into some pretty important biology. You could have two species that prefer the same temperature, but one may be more sensitive to lower levels of oxygen. When the water gets warm, they get the oxygen squeeze at the point where their shared zones overlap. That’s accounted for with the oxygen variable on the calculator. Choose low oxygen and the effective thermal window becomes smaller. Because now one of the species cannot use the top end of the shared range.
When we see fish pop up in odd locations during hot weather spells, this is part of the reason why. Not looking for the coolest water…looking for breathable water.
The last piece is habitat partitioning. Although the environment may be thermally compressed, two species might still co-exist by using different cover types or vertical layers. You have one fishing the surface, another near the bottom. Describe this with the habitat partitioning input. Selecting compressed indicates high competition. Selecting layered recognizes physical separation as reducing conflict. Sounds like something you’d witness out on the water.
How many times do we fish a pond and find both bass and bluegill thriving? They divide the pond differently; bluegill pick off insects near the vegetation, while bass take the larger prey in open water.
Don’t think about the resulting overlap score as a yes or no answer. Think of it as a screening value. A high score indicates that there’s some risk involved. Examine the details: How much cover? How much prey available? A low score indicates separation. Chances are that temperature is pushing them away from each other. This is not a bad thing.
Some competition fuels an ecosystem’s health. We’re looking for the limits. Once you know the thermal pressure points, then you can tweak the habitat in ways that help both species thrive. Adjust water flow to preserve oxygen. Add cover to provide refuges.
That’s when a simple temperature reading becomes a map of the whole aquatic community. This is how you begin understanding what the water is actualy doing, day by day.