Personal Best Comparison Calculator
Compare a fresh catch with your personal best using weight, length, girth, scale variance, species benchmarks, and tackle class.
📌Catch comparison presets
⚙Personal best inputs
Personal best comparison
Formula breakdown
📋Gear and species comparison grid
Largemouth bass
Smallmouth bass
Rainbow trout
Walleye
Channel catfish
Northern pike
Redfish
Striped bass
📐Reference tables
| Species | Strong PB Weight | Trophy Length | Typical PB Gear |
|---|---|---|---|
| Largemouth bass | 8 lb / 3.6 kg | 24 in / 61 cm | 12-20 lb, medium-heavy |
| Smallmouth bass | 6 lb / 2.7 kg | 22 in / 56 cm | 8-12 lb, medium |
| Rainbow trout | 8 lb / 3.6 kg | 25 in / 64 cm | 4-8 lb, light |
| Walleye | 10 lb / 4.5 kg | 30 in / 76 cm | 8-12 lb, medium |
| Channel catfish | 20 lb / 9.1 kg | 34 in / 86 cm | 15-30 lb, heavy |
| Northern pike | 20 lb / 9.1 kg | 40 in / 102 cm | 20-40 lb, heavy |
| Redfish | 30 lb / 13.6 kg | 40 in / 102 cm | 15-30 lb, surf or inshore |
| Striped bass | 40 lb / 18.1 kg | 45 in / 114 cm | 20-50 lb, surf |
| PB Score | Meaning | Action | Record Note |
|---|---|---|---|
| Under 50% | Good fish, far from PB | Photo or quick release | Track if seasonally useful |
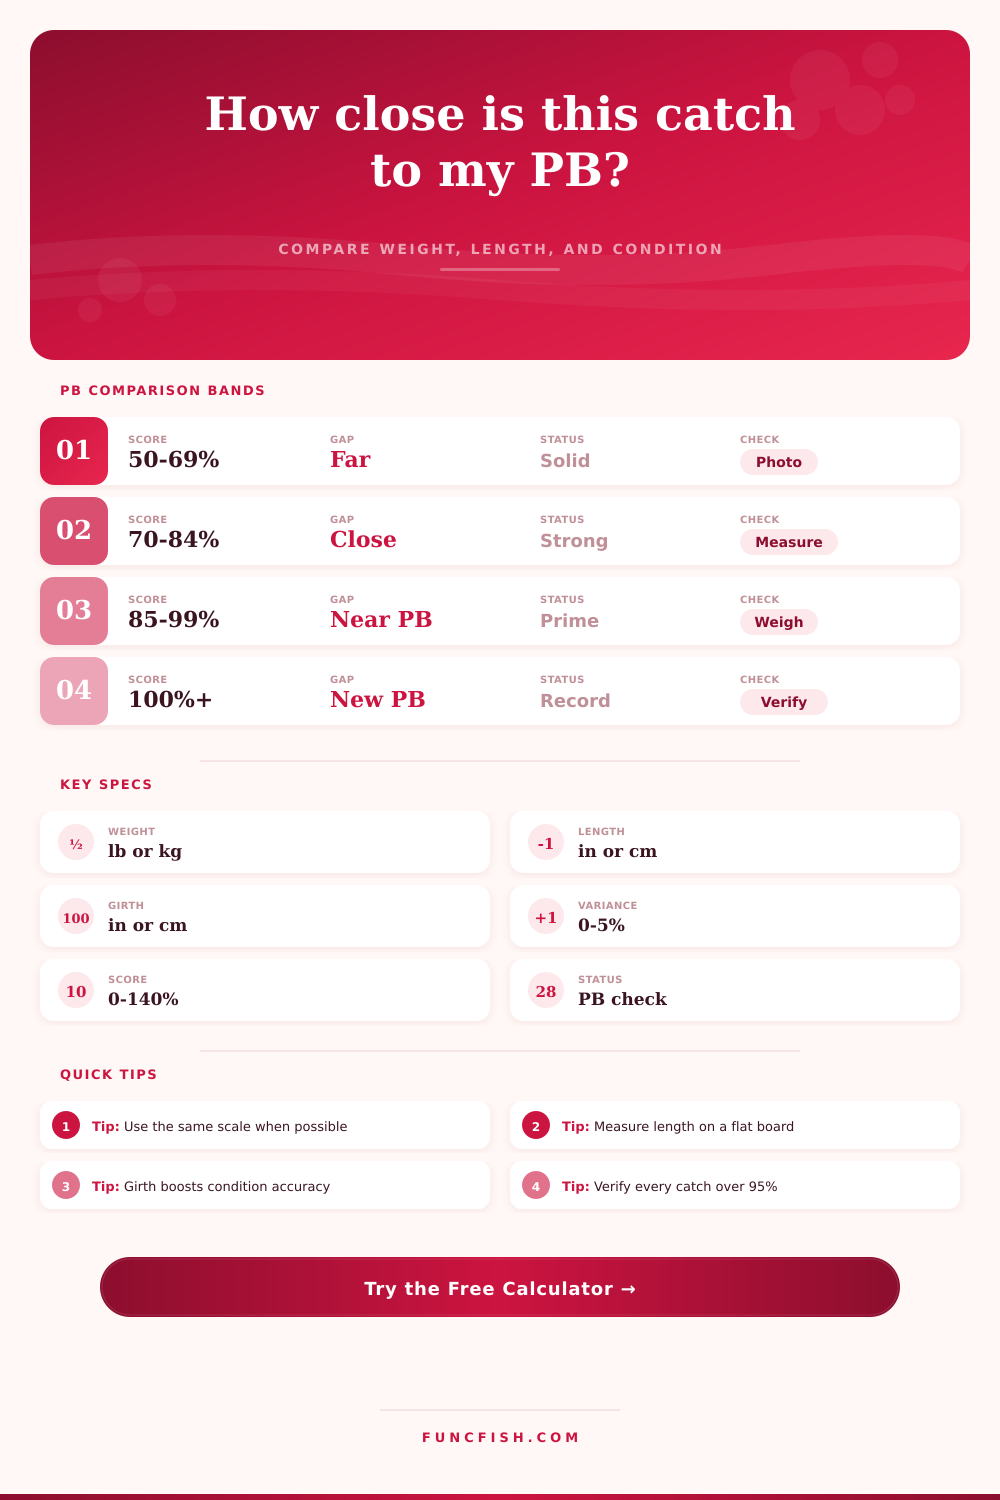
| 50-69% | Solid catch | Log weight and length | Compare to annual best |
| 70-84% | Strong contender | Use a measured board | Note lure, depth, and tide |
| 85-99% | Near personal best | Re-weigh once stable | Photograph scale display |
| 100% or more | New personal best | Verify weight and length | Save exact unit reading |
| Gear Class | Line Window | Best PB Use | Scale Precision |
|---|---|---|---|
| Ultralight spinning | 2-6 lb / 1-3 kg | Panfish, stocked trout | 1 oz / 25 g |
| Light spinning | 4-8 lb / 2-4 kg | Trout, finesse bass | 1 oz / 25 g |
| Medium spinning | 8-12 lb / 4-6 kg | Walleye, smallmouth | 2 oz / 50 g |
| Medium-heavy baitcast | 12-20 lb / 6-9 kg | Bass, light pike | 2 oz / 50 g |
| Surf casting | 20-50 lb / 9-23 kg | Striped bass, redfish | 4 oz / 100 g |
| Trolling setup | 15-40 lb / 7-18 kg | Walleye, salmon, pike | 4 oz / 100 g |
| Fly tackle | 4-16 lb / 2-7 kg | Trout, bass, inshore | 1 oz / 25 g |
| Heavy cover rig | 30-65 lb / 14-29 kg | Vegetation, wood, docks | 4 oz / 100 g |
| Measurement | Imperial Formula | Metric Equivalent | Use In Calculator |
|---|---|---|---|
| Weight score | Catch lb / PB lb | Catch kg / PB kg | Primary PB percentage |
| Weight gap | PB lb - catch lb | PB kg - catch kg | Upgrade amount needed |
| Length score | Catch in / PB in | Catch cm / PB cm | Frame and growth comparison |
| Formula weight | L x G x G / 800 | L x G x G / 30000 | Condition index check |
| Scale range | Weight +/- variance | Weight +/- variance | PB verification window |
💡PB comparison checks
Tip: When a catch is within five percent of your personal best, compare both the raw reading and the variance-adjusted high reading before calling it official.
Tip: Length and girth help explain a surprising scale number. A short, thick fish can beat a longer but leaner personal best.
We’ve all done it. You let go of a big one, only to realize a few minutes later that it might of been your biggest ever, but you don’t really know. It always seem like the battle gets blurry fast and next thing you know you’re stuck with an idea of what size and what weight was on the end of line. Unfortunately, it never realy holds water when examined because chances are you’ll remember the splash better than the number on scale. To compare the latest catch against previous records, something more concrete is needed different than a mental note of rod deflection.
Instead of relying solely on the rush of excitement, you can use some actual numbers. That’s where the calculator comes into play. Enter your dimensions and let the program do the work for you. You will no longer wonder whether that 20-pound pike was actualy bigger than last year’s keepers or if it just felt like it because it was splashing around in shallow water.
How to Measure Your Catch Correctly
Weight is only part of the story. For example, if you catch a fish that are 6 inches longer than your personal best, it may actually weigh the exact same amount because of seasonal conditions. However, it is still a biological win for the fish in terms of both age and size.
You can also enter in girth along with weight and it takes into account length as well as girth. The girth is especially important because you can use it to help determine a condition index. What does this tell us? It tells us whether a fish is chunky and full of bait, or lean from spawning. It may not be as heavy than your last one, but it could have a higher frame score indicating a leaner fish. That’s what most folks overlook when just looking at scale.
Food availability, water temperatures, and the fish spawn cycle can all affect how much a fish will weigh for its length. There’s also the hidden variable of scale difference that blow up a lot of personal best claims. Was the battery low? Did you use a different scale on this catch than you did on your record? That changes your baseline.
And we let you plug in a variance percentage into the calculator which basically gives you a buffer zone around your numbers. This means it’s important when verifying. A fish can’t come and land within five percent of your best and just take the lower reading. You have to go by the variance-adjusted high end or do a second weigh-in to be fair to yourself.
Consistency is more important then precision. Two different accurate scales once is worse than same flawed scale twice. But the species benchmark tables gives some perspective on the reality of what can be achieved. It doesn’t make much sense to compare a bass to a trout by the exact same benchmarks. One have a much higher weight-to-length ratio than another.
To help you understand how something stacks up, the reference data give you those typical trophy marks and gear classes to set your expectations. You’d feel very differently about a ten pound catfish on heavy line versus a ten pound walleye on ultralight gear, though it might look the same on paper. Knowing the gear class helps you realize how hard that fish was to catch. It is not just about how much it weighed.
When the fish is in the water, don’t rush the measuring process. Don’t make the mistake many angler do. Towel it off. The wet fish will read high on the scale. It’s weighted down with water. Measure on a level flat surface. Always. Don’t get false positives from small procedural details. If fishing alone, snap a picture of the scale display before you release the fish. Better than memory, a photo keeps the exact moment of truth before the doubt sets in.
A personal best doesn’t have to be about the number on the screen, but rather the journey that got you there. It’s the careful look at the fish and the pursuit itself that bring us such enjoyment. Measuring the fish correctly by its size and weight respect both our skill as anglers and the fish itself. It creates a history we can rely upon with our angling careers, instead of trusting a feeling that lasts only as long as the fight.
Next time you feel that big bite on the other end of line, you’ll know exactly how it stacks up against your personal record.