Fish Growth Increment Calculator
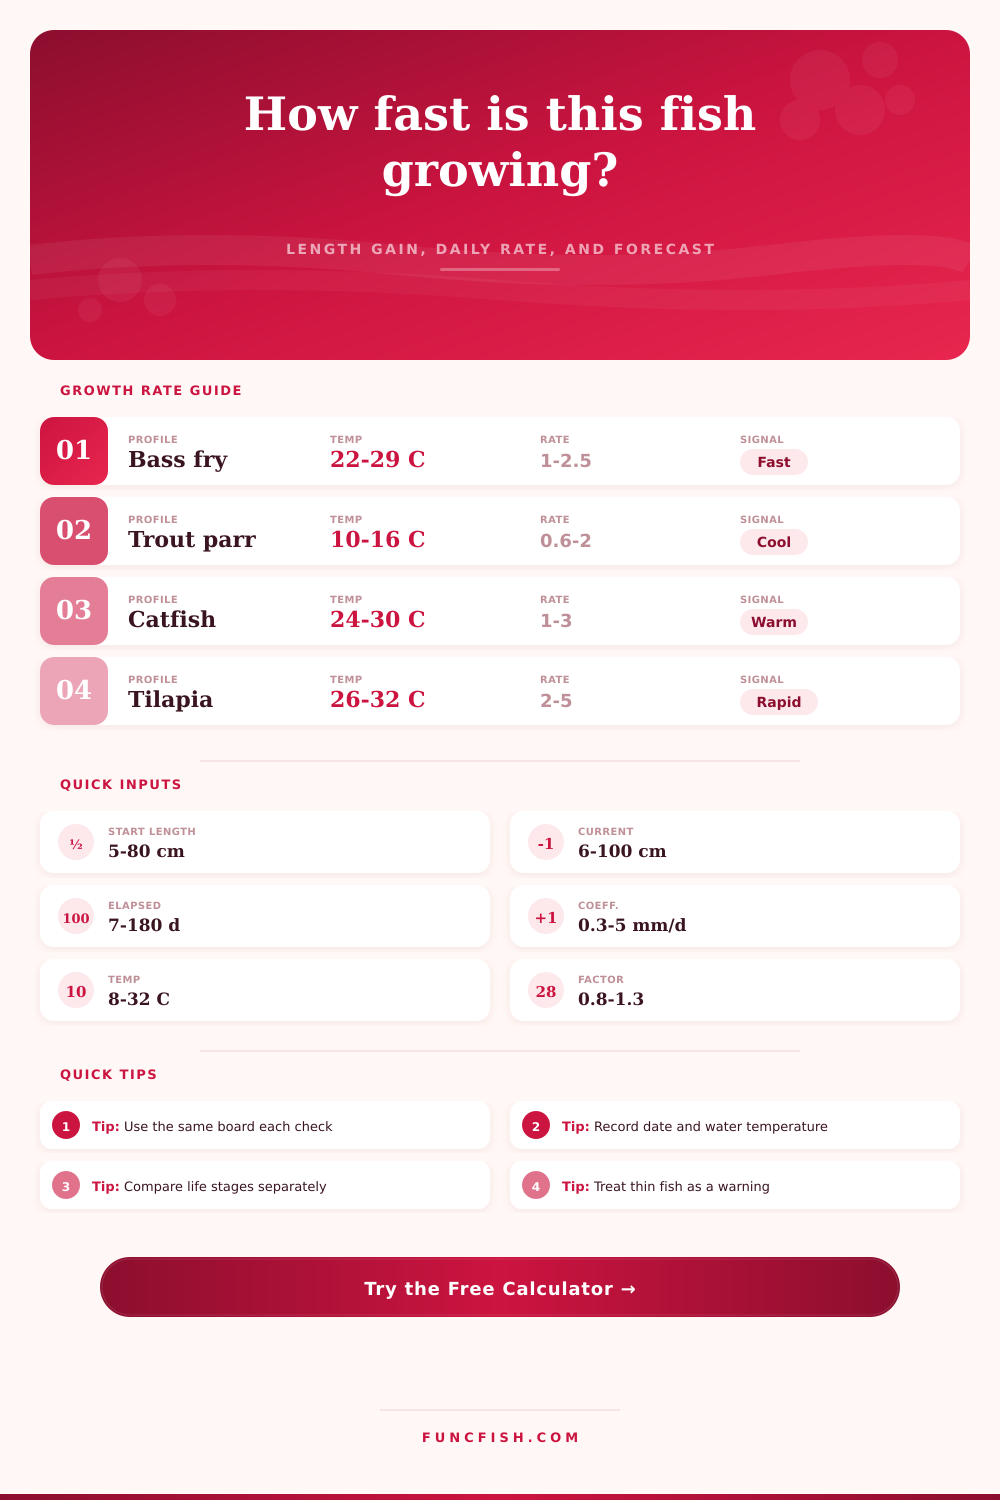
Estimate observed length gain, daily growth rate, condition-adjusted performance, and a short-term forecast from real measurement intervals.
📌Species and life-stage presets
⚙Growth measurements
Use the preset value as a reference growth rate, then adjust it for local strain or culture records.
Use 1.00 for normal body condition, below 0.90 for thin fish, and above 1.10 for heavy fish.
Growth increment summary
Full breakdown
📋Gear and species comparison grid
Bass Fingerlings
Trout Parr
Catfish Stockers
Tilapia Grow-Out
Salmon Smolts
Barramundi Nursery
Carp Yearlings
Koi Juveniles
📚Reference tables
| Species or life stage | Reference coefficient | Preferred temperature | Typical use |
|---|---|---|---|
| Largemouth bass fingerling | 1.25 mm/day | 72-84°F / 22-29°C | Pond recruitment checks |
| Rainbow trout parr | 0.95 mm/day | 50-61°F / 10-16°C | Cool-water rearing |
| Channel catfish stocker | 1.60 mm/day | 75-86°F / 24-30°C | Warm pond sampling |
| Nile tilapia grow-out | 2.80 mm/day | 79-90°F / 26-32°C | High-feed production |
| Atlantic salmon smolt | 1.10 mm/day | 46-57°F / 8-14°C | Smolt window tracking |
| Barramundi nursery | 2.35 mm/day | 82-90°F / 28-32°C | Rapid nursery grading |
| Temperature response | Modifier range | Growth signal | Calculator treatment |
|---|---|---|---|
| Below preferred band | 0.20-0.75 | Metabolism slows | Expected increment reduced |
| Inside preferred band | 0.85-1.20 | Normal feeding response | Coefficient stays near baseline |
| Warm but tolerated | 0.70-1.10 | Short-term growth can hold | Heat penalty limits forecast |
| Outside tolerance | 0.15-0.45 | Stress likely | Index is flagged as low confidence |
| Modifier | Low value | High value | Interpretation |
|---|---|---|---|
| Food availability | 0.55 restricted | 1.35 optimal | Captures ration, forage, and competition |
| Age class | 0.32 adult | 1.45 fry | Young fish convert length faster |
| Condition factor | 0.80 thin | 1.20 heavy | Thin fish lose growth potential |
| Measurement method | 0.88 rough | 1.00 precise | Changes confidence, not biology |
| Growth index | Performance band | Observed meaning | Sampling response |
|---|---|---|---|
| Below 65% | Slow | Growth trails expectation | Check feed, density, temperature, and health |
| 65-90% | Below target | Increment is usable but lagging | Repeat sample before changing plans |
| 90-115% | On track | Observed growth matches profile | Keep the same sampling interval |
| Above 115% | Fast | Fish are outpacing the coefficient | Consider grading or updating the coefficient |
💡Measurement tips
Tip: Keep the same length definition for every sample. Mixing total length, fork length, and standard length can hide real growth patterns.
Tip: A high length gain with a falling condition factor can mean fish are getting longer without adding enough body reserves.
Look at a few of those fish out of the net. They look like they looked last month. That means a lack of gain could be due to things like temperature or food rather than your efforts failing. Growth measurement is essential for honest feedback in aquaculture. You can’t feed based on hope when there is no measuring going on. You feed based off data.
Once you plug your length and temperature into the calculator, it does all the math for you. That way, if your fish aren’t growing well, you know whether it’s because of cold water or bad food. It’s good to know what you’re looking at when you look at it.
Why Measuring Fish Growth Matters
Unlike a tree, fish don’t grow linearly. Fish growth follow a curve. Fry grow fast; juveniles slow down; adults reaches a sort of plateau. Because of that, the age class modifier in the tool come into play. A fingerling should increase in length fast. If it doesn’t, something ain’t right. An adult trout increasing only a millimeter per day are meeting biological expectations. It would of been wrong to compare those two groups together without correcting for age. You can’t judge a sprinter on marathon standards.
Metabolism runs on temperature. The colder the water, the slower the metabolism; the warmer, the faster. But get too warm and it’s stress time. Growth stops. The “thermal window” for a fish like tilapia and bass is illustrated below. You want to be operating within this preferred temperature band.
This is where premium feed comes into play. If the average temperature is running outside of the optimum range, no amount of premium feed will compensate. The calculator rates your placement in that thermal window by modifying the expected growth index to match. Does the water work for you or against you? It answers that question.
There’s one more hidden variable, food. It may seem obvious that if they’re fed every day, they’ve got plenty of food, right? Wrong. In a full pond, competition is keen. The dominants eats first and grow the fastest, leaving the rest with scraps. Your average length data get skewed. You might see decent growth in the group mean while part of the population are starving. With this tool, you can correct for food limitation. That allows you to distinguish biological limitations from ration problems.
Feed heavily and have a low index on the adjusted values? Guess what you’ve got…you guessed it, A density problem.
One of the secret indicators of fish health is condition factor. Fish will become longer without becoming heavier. That typically indicates a lack of adequate protein for growth, but may also be a sign of a disease draining energy reserves. Length increasing while condition factor falls are another red flag. The fish isn’t adding muscle; it’s just stretching out. You want both of these measures moving together. Thin fish is less able to withstand environmental shocks and is more likely to fall prey to parasites. Tracking them over time will show trends you wouldn’t see with just one snapshot.
And finally, be consistent with your measurements. Don’t use a caliper one week and then a board the next week. That will throw off your results. Don’t mix and match total lengths and fork lengths. That will muck up all your data. Commit to a single measurement method. Use the same equipment each time. Note down the temperature each time and date it. Consistent habits adds meaning to the numbers. Trend and direction is what matters in growth calculation, not micrometer precision. Your data doesn’t have to be perfect. It just has to be consistent. Once you’ve got that nailed down, the rest of it falls in place.
Knowing these drivers helps plan the next sample interval. If growth is on pace, space them further apart. If not, check earlier. That will save labor and time. It also protects water quality by avoiding an overfeed during slower periods. Remember: clean water = healthy fish. Healthy fish = growth.
The tricky part is putting all of this into perspective so you see it. When you connect the dots from food, to temperature, to actualy size gain, the mystery dissapears. Guesswork stops. Management begins. Sooner or later, those fish in the net seem noticeably larger then last month.