Gill Net CPUE Calculator
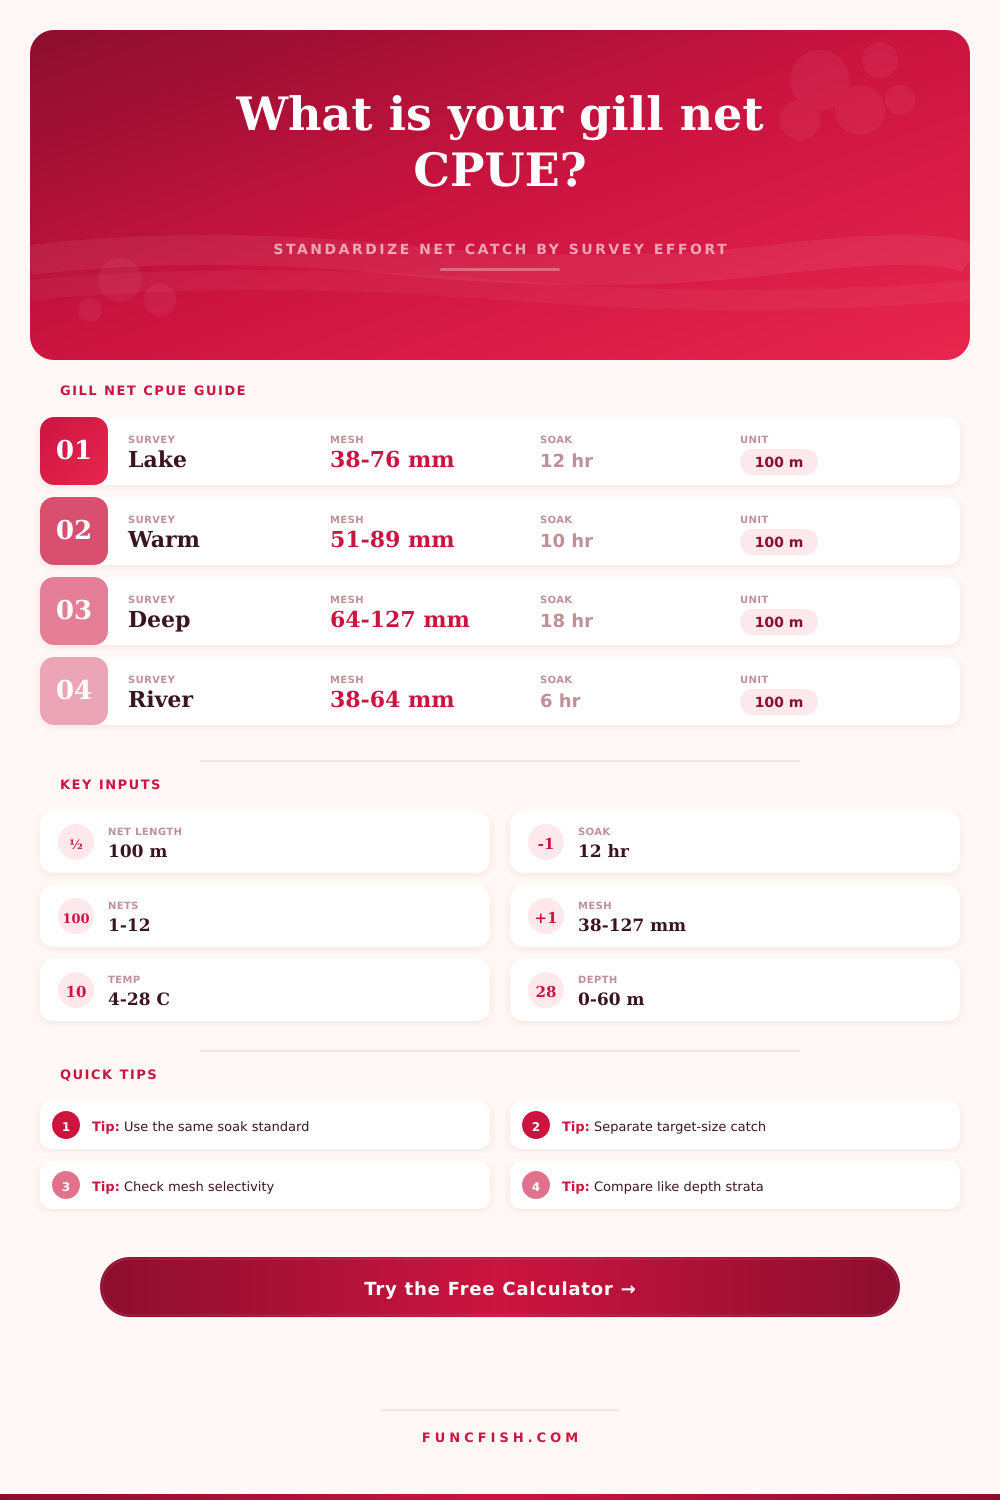
Standardize gill-net catch by net length, soak time, mesh panel, size class, water temperature, depth stratum, net count, and selectivity factor.
📌Gill-net survey presets
⚙Effort and catch inputs
Gill-net CPUE results
Full breakdown
📊Species and net comparison grid
Walleye Index
Yellow Perch
Lake Trout
Pike Survey
📋Gill-net CPUE reference tables
| Standard unit | Formula basis | Best use | Interpretation note |
|---|---|---|---|
| Fish per 100 m per 12 h | Catch / (m × hr / 1200) | Overnight lake sets | Good for short index-panel comparisons |
| Fish per 100 m per 24 h | Catch / (m × hr / 2400) | Full-day soak plans | Raises values relative to 12-hour standard |
| Fish per net-night | Catch / (nets × hr / 12) | Fixed fleet surveys | Assumes net length is constant |
| Fish per 1000 m per 24 h | Catch / (m × hr / 24000) | Large offshore effort | Useful when long fleets are deployed |
| Mesh panel | Nominal mesh | Selectivity center | Default multiplier |
|---|---|---|---|
| Small mesh | 25-38 mm | Juvenile and panfish | 0.92 |
| Standard mesh | 38-64 mm | Mixed adult fish | 1.00 |
| Walleye mesh | 51-76 mm | Medium predators | 1.06 |
| Large mesh | 76-102 mm | Large-bodied fish | 1.12 |
| Deepwater mesh | 89-127 mm | Trout, char, whitefish | 1.18 |
| Experimental multi-mesh | 25-127 mm | Broad size spectrum | 0.98 |
| Condition | Multiplier range | Direction | Use in calculator |
|---|---|---|---|
| Cold water below 8 C | 0.78-0.92 | Lower encounters | Adjustment lifts comparable CPUE |
| Moderate water 12-20 C | 0.98-1.08 | Baseline activity | Small or no correction |
| Warm water above 24 C | 0.82-0.96 | Stress or avoidance | Correction depends on species group |
| Deep or profundal set | 0.84-1.08 | Stratum-specific | Applied after temperature and mesh |
| Target CPUE band | Index class | Survey meaning | Comparison caution |
|---|---|---|---|
| 0-5 | Low | Weak catch signal | Check enough net nights were sampled |
| 5-20 | Moderate | Detectable stock signal | Compare with the same mesh series |
| 20-60 | High | Strong abundance signal | Look for size-class imbalance |
| 60+ | Very high | Dense or vulnerable aggregation | Confirm set location was not atypical |
💡Survey calculation tips
Tip: Keep raw CPUE and adjusted CPUE in separate columns. Raw values preserve the field record; adjusted values are for comparing unlike sets.
Tip: When one mesh panel catches nearly all target fish, rerun the calculator by panel so selectivity does not hide a strong size bias.
You know the sinking feeling. You wake up early and pull up a load of nets that weigh tons. You notice something isn’t right: the numbers don’t add up to the number sampled on the survey last week. You put out the exact same nets where you always fish. One haul was a beauty. The next one looked more like a bad bet.
The thing is fishing wasn’t the issue. More often than not it were the math associated with putting the effort into the water. Fisheries is monitored by catch per unit effort. That is great because it’s the simplest way to measure success. But it’s also the quickest way to screw it up if you let variable conditions determines the outcome.
Why You Should Use This Fishing Calculator
Standardize your mesh selectivity; your net length; your soak time. If you don’t then you’re not measuring abundance. You’re measuring luck.
To do all this heavy lifting, we’ve created the calculator up top, which turns those variables into a common index so you can compare them. It simply requests the raw number of each size class (small, target and large) and divides it against a standardized effort unit in terms of time and gear used. Why? Because a 200 meter net fished for 12 hours has a different encounter probability than a 100 meter net fished for six hours. And if you don’t account for that, your data is just noise. With this tool, you must face facts about your own survey design instead of hiding behind raw numbers.
There’s selectivity too. You’re not going to snag all the fish with whatever mesh size you use and that skews things. Some fish, like panfish and juveniles, will get pulled into a small mesh, while bigger ones will ignore a larger walleye mesh and won’t even touch the bait. Put those two catches side by side and you’ll think the lake is barren when realy, it’s just loaded with fish that aren’t what you want.
The tool breaks out those multipliers in the reference tables to explain how depth and temperature also skew catches. Activity is suppressed by cold temps, so even though they may be present, the catch rate go down. Fish on deep strata may be completely different species. These environmental factors help you get a better idea of who’s actualy up in the water column.
CPUE is a misleadingly simple math exercise for most amateurs. Divide up the number of nets into the total fish and bam! Done. Wrong.
To manage properly, you must first separate out the bycatch from target size class. In other words, if you’re monitoring for adult walleyes, those thirty little perch you picked up along the way are statistical noise (interference), not signal. The calculator will isolate the target share so you can tell whether the stock structure is either collapsing or holding. And a high CPUE with no target sized fish? That tells you something about a recruitment pulse that has not yet shown itself in the fishery. This is valuable info. But only if parsed accordingly.
There is no such thing as field perfection. Nets gets blown around by wind. Lines get stretched out in current. Moon phases and seasons impact fish behavior. A surprise front that freaks the whole lake doesn’t come into account on any spreadsheet. That’s when experience fills the gap between theory and reality.
Use the calculated index as a starting point, not a decision maker. Then plot it against history under the exact same depth layers and using the same mesh. The only way to buy confidence in the long term is consistency. Change protocols from one year to the next and you’ll lose sight of the forest through the trees.
The tool has several preset options that help set expectations based off habitat and species type. Yellow perch aren’t going to behave like lake trout and the best time to catch them won’t be the same either. Applying the same amount of time and effort to each will lead to conflicting results. Choose the correct species group, and you’re setting up the effort units to match the biology of what you’re counting. Sounds technical, but it’s actualy more along the lines of respecting the animal’s behavior and matching your survey efforts accordingly.
A gill net survey is ultimately a snapshot in time of a changing system. It’s capturing what’s out there to be captured, not necessarily what’s there. And it must of been done while accounting for environmental factors, effort, and selectivity. Then, however, that snapshot becomes a useful measure.
You no longer have to guess if the lake is depleted or productive. You see the trends. You see what happens over time. Of course, the numbers are going to fluctuate because they always do, but they’ll fluctuate around something you can finally trust. That insight alone makes the extra effort of calculating worth it.