Parasite Load by Season Calculator
Estimate relative seasonal parasite pressure from fish species, water temperature, month, intermediate hosts, fish age or size, habitat, crowding, and observation sample size.
📌Parasite and season presets
⚙Risk inputs
Snails, copepods, amphipods, birds, or forage hosts seen near the sample area.
Seasonal parasite load estimate
Full breakdown
📋Species and parasite pressure grid
Perch / Panfish
Black Bass
Trout
Walleye
Catfish
Pike / Muskie
Carp / Suckers
Striped Bass
📈Season and temperature reference
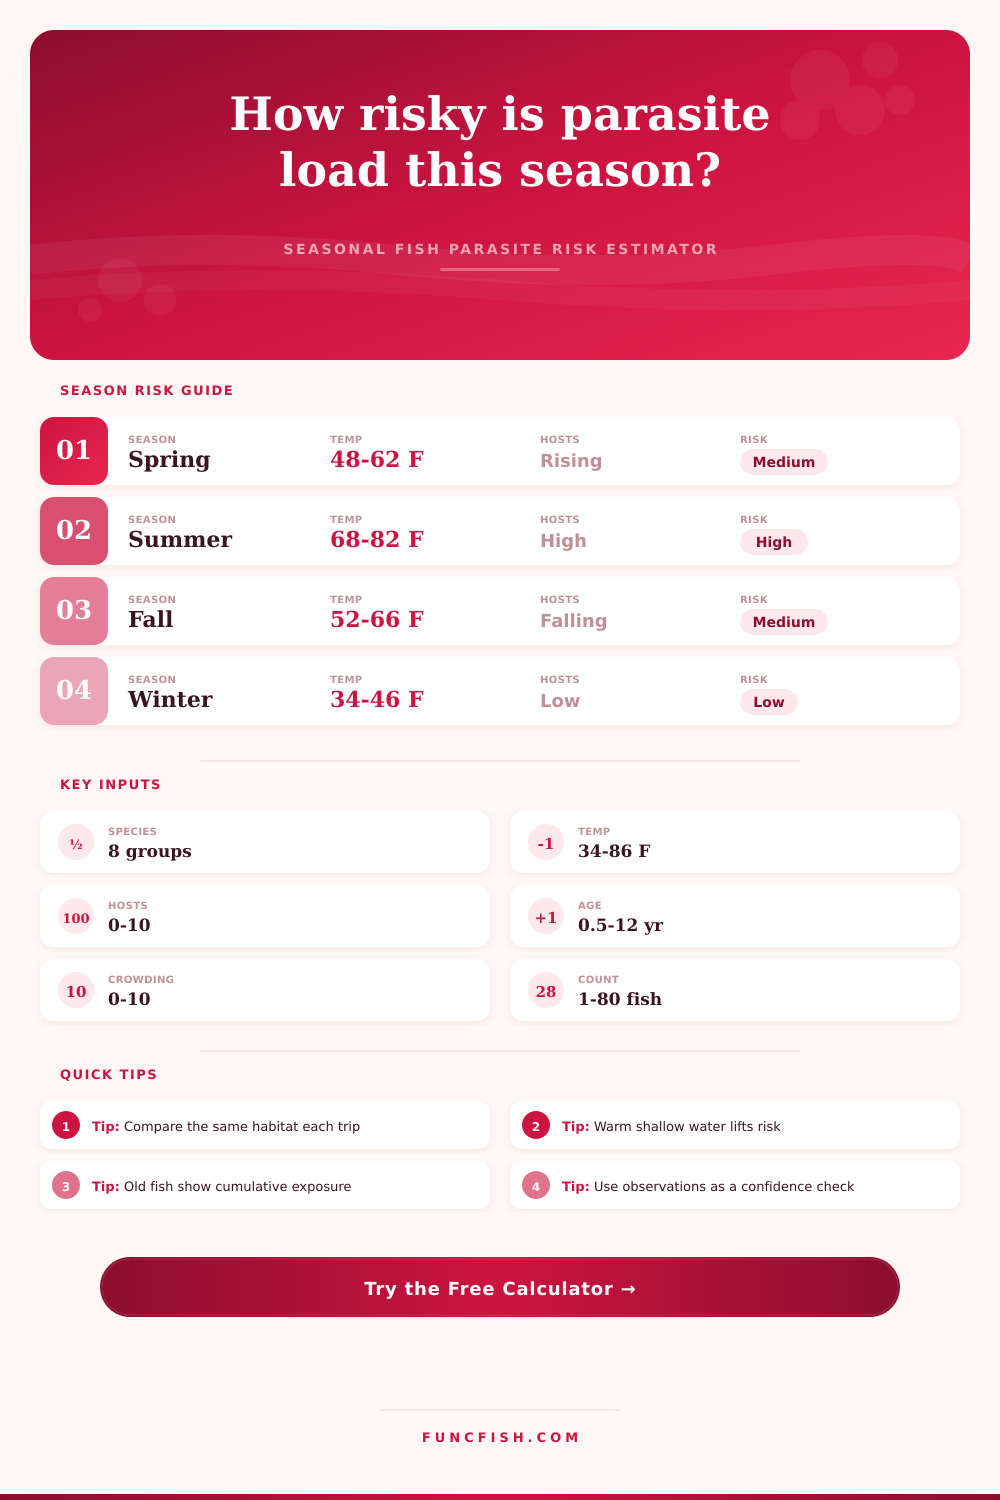
| Season window | Typical water temp | Season pressure | Interpretation |
|---|---|---|---|
| Late winter | 34-44°F / 1-7°C | Low | Cold slows external activity |
| Spring warm-up | 45-62°F / 7-17°C | Rising | Snail and copepod contact increases |
| Summer peak | 68-82°F / 20-28°C | High | Warm shallow habitat raises exposure |
| Fall cool-down | 52-66°F / 11-19°C | Moderate | Older accumulated signs remain visible |
| Cold winter | 32-40°F / 0-4°C | Low | New visible infections usually slow |
| Parasite focus | Best indicator | Host driver | Season sensitivity |
|---|---|---|---|
| Black spot trematodes | Dark skin cysts | Snails and fish-eating birds | Spring to summer rise |
| Yellow grub | Yellow-white cysts | Snails, birds, shallow fish | Warm-water peak |
| Larval tapeworms | Body cavity cysts | Copepods and prey fish | Age and diet weighted |
| Gill flukes | Pale or irritated gills | Close fish contact | Crowding responsive |
| Anchor worm | Threadlike external worms | Copepods and warm water | Late spring to summer |
| Fish lice / sea lice | Mobile flat crustaceans | Direct contact and salinity | Warm or run-timed |
🧪Habitat and sample reference
| Habitat type | Host expectation | Risk adjustment | Reason |
|---|---|---|---|
| Clear open lake | Low to moderate | -8 score | Less shoreline host contact |
| Weedy littoral zone | High | +13 score | Snails and small hosts concentrate |
| Muddy slough | High | +16 score | Warm, productive, low flow habitat |
| River run | Moderate | -2 score | Current disperses some hosts |
| Reservoir bay | Moderate-high | +7 score | Warm coves and forage contact |
| Cold stream | Low | -14 score | Cold flow limits many external cycles |
| Brackish tidal | Variable | +4 score | Run timing changes exposure |
| Observation count | Confidence | Prevalence use | Best practice |
|---|---|---|---|
| 1-5 fish | Very low | Screening only | Do not over-read one catch |
| 6-15 fish | Low | Local signal | Compare with another visit |
| 16-30 fish | Fair | Useful trend | Record habitat and length range |
| 31-50 fish | Good | Strong local read | Separate adults and juveniles |
| 51+ fish | High | Robust estimate | Watch for site bias |
💡Field interpretation tips
Tip: Keep sample notes tied to the same shoreline, bay, or reach. Seasonal comparisons get noisy when habitat changes more than the fish do.
Tip: Use visible signs as a relative index. Small skin cysts, gill irritation, and external worms do not represent every internal parasite present.
It’s early summer, the water’s warm, you pull a bass out of shallow water and look at it. You see some yellow spots around its tail. Is that a symptom of something bad? Or is it just what happens on lake as bass go through motions?
There are parasites. Most anglers believe all parasite are bad. If you find one, then the fish must be sick, right? Wrong. There is a lot of misunderstanding there. In fact, parasites is a vital part of the ecosystem and often have much more to do with environmental conditions different than the health of any single fish.
Why Parasites Are Normal in Summer
The calculator above will do the math for you. It can help you figure out if those spots mean it’s a high risk time of year, or just typical seasonal pressure. The lifecycle of parasites is something most of us don’t notice, but it’s driven by seasonality.
For example, some parasite (e.g., black spot trematodes) use an intermediate host like snail. This means fish becomes at risk when those snails multiply rapidly, typically in the spring when water temperatures rise. Come summertime, the water is warm enough for the parasite to mature on the fish’s skin. So why do you see more visible signs in July heat than in January chill? Because the tool is weighted heavily towards temperature and month in the risk assessment. Put in a high temp during peak summer months and the risk score will jump.
It is not just about how many snails are there, but whether the water is warm enough to speed up intermediate host reproductive cycle. That brings us to the other side of the equation: habitat type. While the calendar is important, so is what kind of place you’re fishing. Snails and copepods (the parasite carriers) hide in a weedy shoreline area, making it a hot spot for parasite transfer. But when current dominates a clear open lake, it scatters those intermediate hosts, reducing your chances of getting infected.
The table on the page explain all of that with a risk score that adjusts according to habitat density. If you spend time in backwater areas or muddy sloughs, prepare yourself for more parasites. Just keep in mind, they have the exact same habitats available to support forage fish, which is why there are so many. You get an ecological tradeoff.
This gets even trickier with age and crowding. Older fish has longer to develop parasites, particularly those that do not show on outside (such as internal tapeworms). So a 5 year old walleye has been around longer and consumed more prey fish during its lifetime than a 2 year old, meaning it’s had more chances to pick up larval tapeworms. And then there’s the issue of crowding; increased contact rates result in faster spreading of direct-lifecycle parasites such as gill flukes.
The calculator accounts for this cumulative exposure when you put in fish density and age. It isn’t a snapshot of one fish; it’s an estimate of the probable history of the population in that particular water body. Theoretical models is checked against observation data.
How many fish do you observe and how many have obvious signs? That’s a prevalence rate, a starting point for real world risk associated with the season. So if the model tells you it is a high risk period because the water is warm and snails are out, but you observe twenty fish and don’t find anything amiss, then your confidence falls. And this means we won’t over-react to potential risks that aren’t really happening. It will remind us that local conditions matter more than broad seasonal factors. Maybe the spring was cold so parasites didn’t emerge as quickly and they haven’t built up yet (despite what the calendar says).
So what does all this mean? In the end, it means knowing your parasites; that’s where context comes into play. Parasite loads aren’t a pass/fail grade for a lake. Instead, they’re a read on current biological activity. If you have high parasite numbers during summer, it doesn’t equate to a broken ecosystem. It means an active and productive one.
Tracking these factors seasonally provides a clearer picture of how hosts, habitat, and temperature interacts with each other. You begin viewing parasites not as pests, but as indicators of a working food web. The next time you see a spotted bass, you won’t think of it as sign of sickness, but instead, as a badge of a vibrant warm-water summer.
You should of seen them in the spring too. It would of been more intense.