🔊 Sonar Equation Calculator
Compute active & passive sonar detection range, signal excess, and figure of merit using the full sonar equation
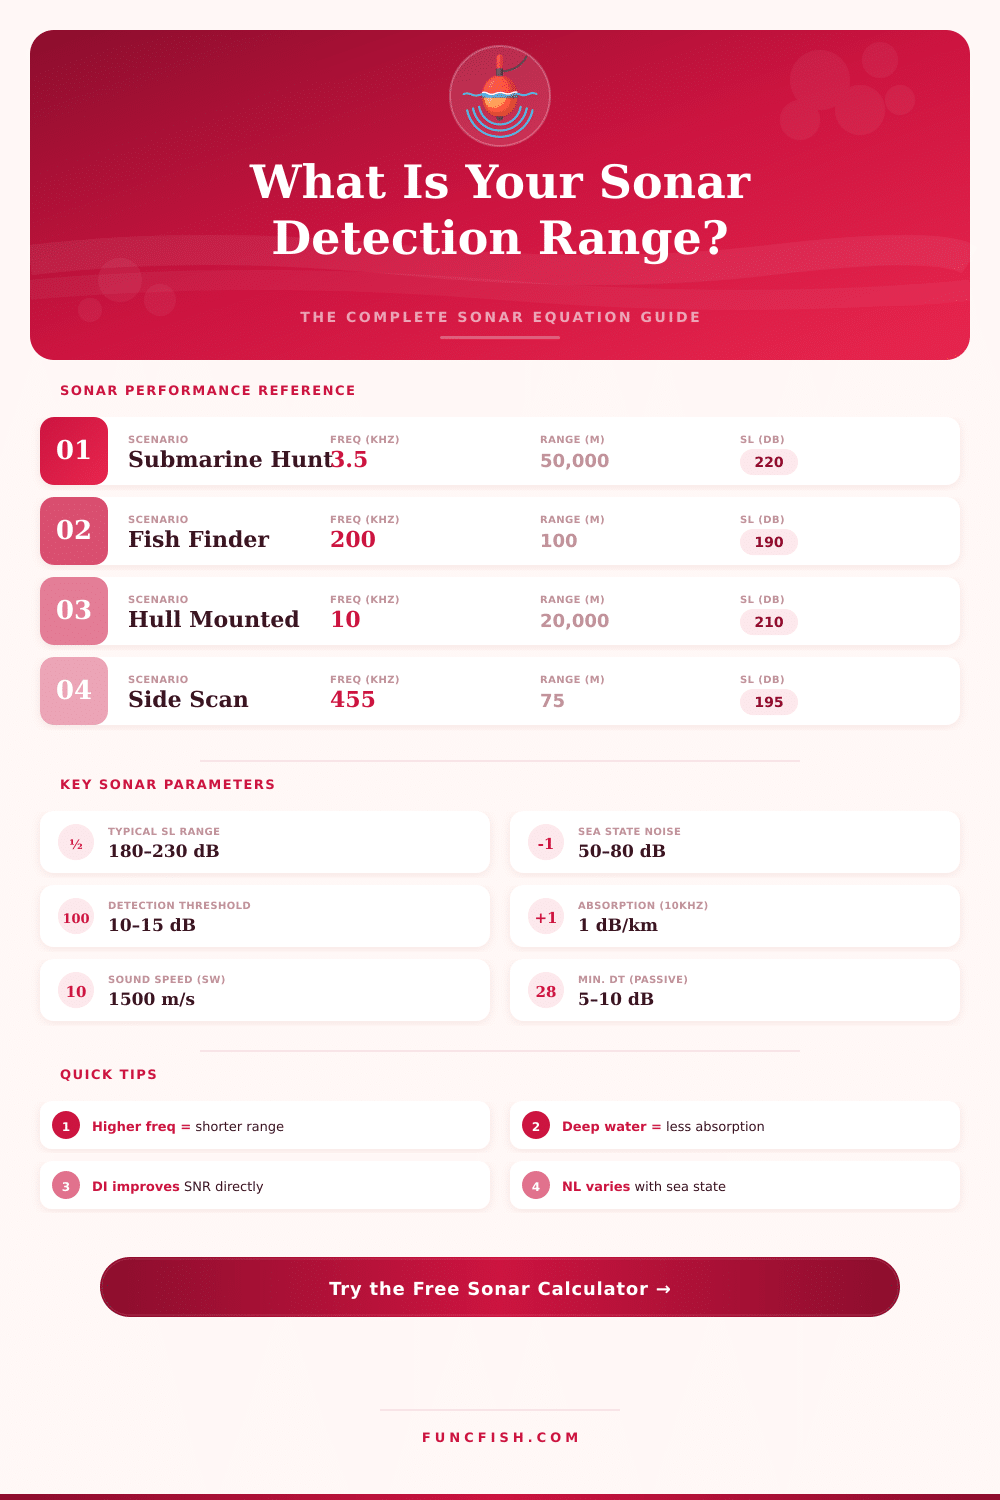
| Scenario | Freq (kHz) | SL (dB) | TS (dB) | NL (dB) | DT (dB) | Typical Range |
|---|---|---|---|---|---|---|
| Submarine Detection | 3.5 | 220 | 15 | 60 | 10 | 30–100 km |
| Hull-Mounted MF | 10 | 215 | 15 | 65 | 10 | 10–50 km |
| Dipping Sonar | 10.5 | 210 | 12 | 65 | 12 | 5–20 km |
| Fish Finder (200kHz) | 200 | 190 | —20 | 50 | 15 | 0.05–0.3 km |
| Side-Scan Survey | 455 | 195 | —10 | 52 | 15 | 0.05–0.15 km |
| Harbor Security | 300 | 200 | 10 | 75 | 12 | 0.2–1 km |
| Shallow Water AUV | 30 | 205 | 10 | 70 | 12 | 1–5 km |
| Mine Detection | 100 | 195 | —5 | 60 | 15 | 0.05–0.5 km |
| Scenario | Freq (Hz) | Target SL (dB) | NL (dB) | DI (dB) | DT (dB) | Typical Range |
|---|---|---|---|---|---|---|
| Nuclear Submarine | 100 | 140 | 60 | 25 | 8 | 100+ km |
| Diesel Submarine | 200 | 120 | 62 | 22 | 10 | 20–80 km |
| Surface Warship | 50 | 160 | 58 | 25 | 8 | 100+ km |
| Commercial Vessel | 100 | 150 | 62 | 20 | 10 | 50–150 km |
| Whale (Blue) | 20 | 188 | 55 | 15 | 5 | 500+ km |
| Torpedo | 50000 | 130 | 65 | 18 | 12 | 1–5 km |
| Underwater Explosion | 1000 | 200 | 65 | 20 | 8 | 200+ km |
| Environment | Sound Speed (m/s) | Absorption @ 10kHz (dB/km) | Ambient NL (dB) | Propagation Loss Type |
|---|---|---|---|---|
| Deep Open Ocean | 1500–1520 | 1.0 | 55–70 | Spherical / Cylindrical |
| Shallow Water | 1480–1510 | 1.2 | 65–80 | Cylindrical + Bottom Loss |
| Arctic Ice-Covered | 1440–1460 | 0.8 | 45–60 | Spherical (low loss) |
| Littoral / Coastal | 1490–1505 | 1.5 | 70–85 | Cylindrical + scattering |
| Freshwater Lake | 1450–1480 | 1.8 | 40–60 | Spherical |
| Harbor / Port | 1490–1510 | 2.0 | 80–95 | High reverberation |
| Tropical Warm Water | 1520–1540 | 0.9 | 60–75 | Spherical / SOFAR |
| Mediterranean | 1505–1520 | 1.1 | 58–73 | Spherical / mixed |
| Frequency | α (dB/km) | Typical Use | Max Range (km) |
|---|---|---|---|
| 100 Hz | 0.001 | SOSUS, long-range passive | 1000+ |
| 1 kHz | 0.06 | Long-range active, LOFAR | 500+ |
| 3.5 kHz | 0.3 | Sub-bottom profiling, ASW | 100–300 |
| 10 kHz | 1.0 | Hull-mounted sonar, MF | 20–50 |
| 30 kHz | 5.0 | Shallow water active, AUV | 2–10 |
| 100 kHz | 35 | Fish finders, mine hunting | 0.1–1 |
| 200 kHz | 60 | Fish finders, bottom survey | 0.05–0.5 |
| 455 kHz | 120 | Side-scan sonar imaging | 0.02–0.2 |
Fishing sonar works by sending sound pulses in the water and measuring the return echo. The submerged sonar transducer sends a beam of sound waves. When those waves hit an object with density different than water, like the swim bladder of fish, part of them bounce back.
The fish finder catches that echo and turns it into an image on the screen
How a Fish Finder Works
The sonar equation explains several things. It takes into account the loudness of the sound source, called source level. It also considers the spreading and weakening of sound during the pulse travel to the target, that you call transmission loss.
In addition is target strength, or the amount of sound reflected by the target back to the sonar. Transmission loss happens again as the reflected pulse travels back. Finally, it includes background noise at the receiver and receiver attributes.
By means of the sonar equation you estimate average signals at various distances for fish of 20 until 90 cm long, in steps of 2.5 cm. Such math helps to foresee what echoes to expect at different distances.
Most sonars operate the range of the sound cone by changing the scanning beam frequency. This matters because different fishing situations require different beams. Many common fish finders have beam angles up to 28 degrees.
In depth of 33 feet, a 20-degree beam hits the bottom in a diameter of around 11.5 feet, covering roughly 100 square feet.
Sonar echoes come mainly from the swim bladder of the fish, because the air inside has very different density than water. The fish forms an arched trace while it swims through the beam. The mark appears when it enters the edge of the cone.
During swimming, the distance of the transducer to fish shortens, and the trace curves upward. Even so anything hollow can give an arch, not only fish.
Deep-sea trawlers and commercial fishermen usually choose low frequency between 50 and 200 kHz. 50 kHz travels further in water than 200 kHz, so it reads greater depth. The resolution is less good then.
A group of fish can seem as one mark. For traditional sonars in shallow water, 200 kHz give a clearer image. Rocks and gravel reflect more strongly than mud and sand because of density differences.
Right placing of the transducer on the transom really mattersfor clear readings.