🐟 Fish Farm Profitability Calculator
Estimate aquaculture yield, feed consumption, stocking requirements & production metrics for your fish farm
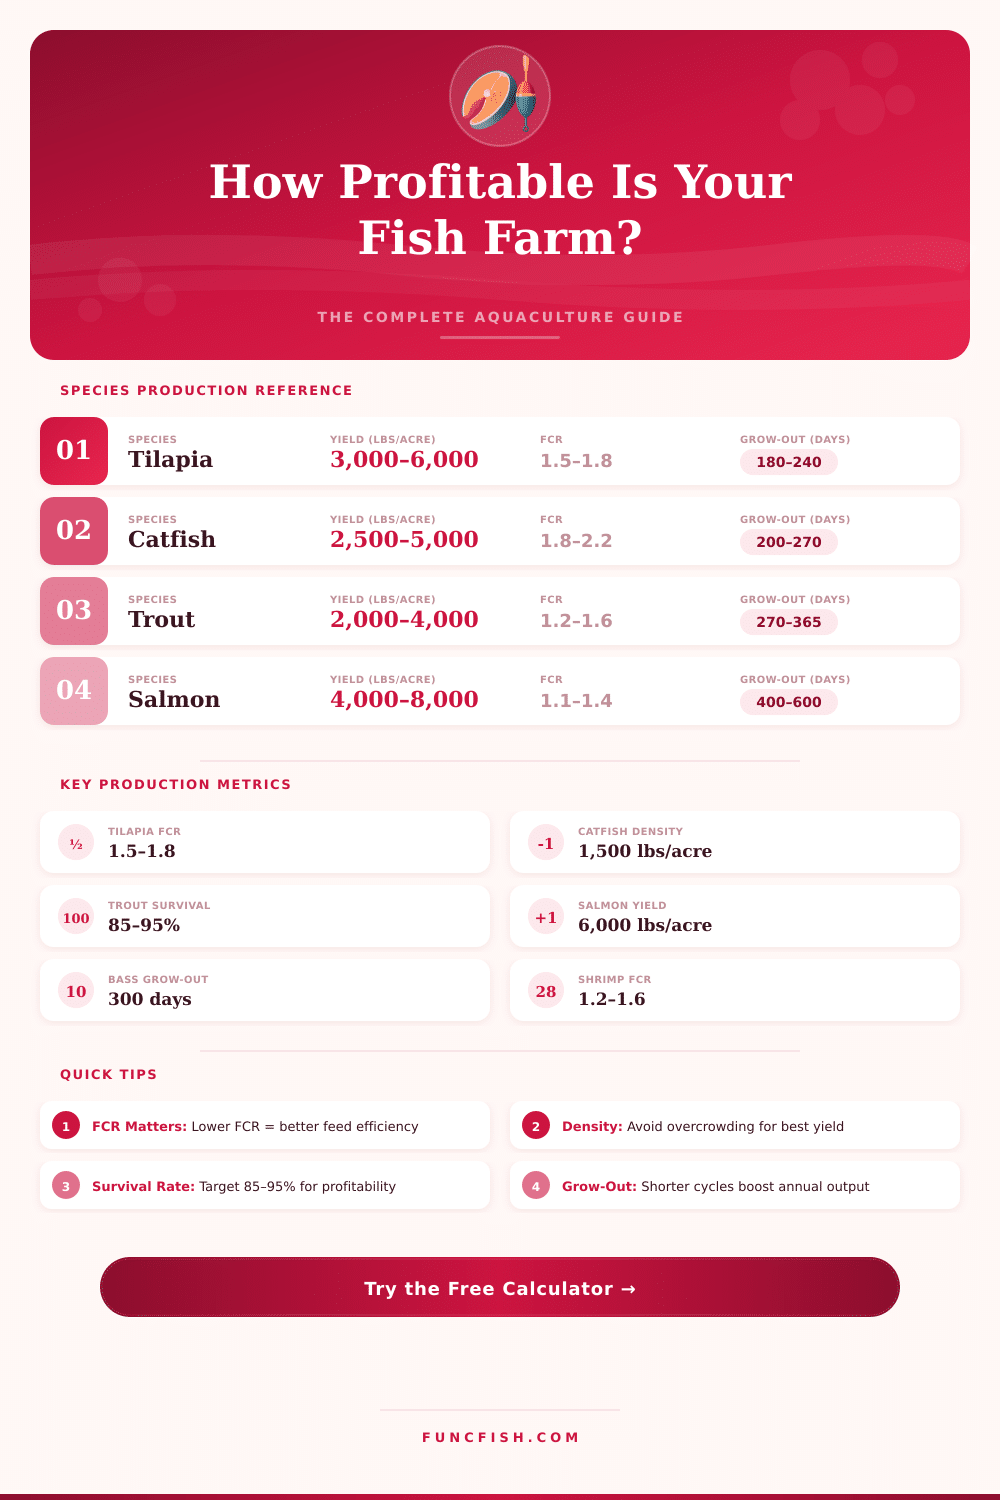
| Species | Optimal Temp (°F) | Typical FCR | Survival Rate | Yield (lbs/acre) | Grow-Out (days) | Harvest Wt (lbs) |
|---|---|---|---|---|---|---|
| Tilapia | 77–86 | 1.5–1.8 | 80–92% | 3,000–6,000 | 180–240 | 1.0–2.0 |
| Channel Catfish | 72–82 | 1.8–2.2 | 75–88% | 2,500–5,000 | 200–270 | 1.5–2.5 |
| Rainbow Trout | 55–65 | 1.2–1.6 | 85–95% | 2,000–4,000 | 270–365 | 0.5–1.5 |
| Atlantic Salmon | 50–62 | 1.1–1.4 | 88–95% | 4,000–8,000 | 400–600 | 8.0–12.0 |
| Largemouth Bass | 70–80 | 1.8–2.4 | 75–85% | 1,500–3,500 | 270–365 | 1.0–2.0 |
| Common Carp | 68–82 | 1.5–2.0 | 82–92% | 2,000–6,000 | 200–300 | 2.0–5.0 |
| Whiteleg Shrimp | 77–86 | 1.2–1.6 | 65–82% | 1,000–3,000 | 90–120 | 0.04–0.07 |
| Yellow Perch | 65–75 | 1.5–2.0 | 80–90% | 1,500–4,000 | 300–400 | 0.3–0.6 |
| System Type | Water Use | Density Capacity | FCR Modifier | Typical Species | Best For |
|---|---|---|---|---|---|
| Earthen Pond | High | Low–Medium | 1.0x (baseline) | Tilapia, Catfish, Carp | Large scale, low tech |
| Raceway / Flow-Through | Very High | High | 0.95x | Trout, Salmon | Cold-water species |
| Net Pen / Cage | Ambient | Medium–High | 0.95x | Salmon, Carp, Tilapia | Marine & lake systems |
| RAS (Recirculating) | Very Low | Very High | 0.9x | Tilapia, Perch, Shrimp | Year-round controlled |
| Tank Culture | Low–Medium | Medium | 0.95x | Tilapia, Perch, Bass | Indoor / small farms |
| Species | Stocking (fish/acre) | Stocking (fish/ha) | Daily Feed (%BW) | Feed Pellet Size (mm) | Protein (%) |
|---|---|---|---|---|---|
| Tilapia | 4,000–8,000 | 10,000–20,000 | 2–5% | 2–6 | 28–32% |
| Channel Catfish | 2,000–6,000 | 5,000–15,000 | 2–4% | 3–8 | 28–36% |
| Rainbow Trout | 8,000–20,000 | 20,000–50,000 | 1–3% | 2–5 | 38–45% |
| Atlantic Salmon | 5,000–15,000 | 12,000–37,000 | 0.5–2% | 3–9 | 38–45% |
| Bass | 1,000–3,000 | 2,500–7,500 | 3–6% | 2–5 | 36–42% |
| Common Carp | 2,000–8,000 | 5,000–20,000 | 2–5% | 2–6 | 25–30% |
| Whiteleg Shrimp | 30,000–150,000 | 75,000–370,000 | 2–8% | 0.5–2 | 30–38% |
| Yellow Perch | 2,000–5,000 | 5,000–12,500 | 2–4% | 1.5–4 | 40–46% |
Fish farming can fit to generate income, however the amount depends on several factors. Market situation, species of fish and the mode as one them cultivate, all seriously affect whether a Fish Farm results in profit or loss. Some species simply give more money than others, and the growth method commonly affects the margin of profit.
Starting is not something easy. For launching a yielding fish business, one requires tropical or warm supplies together with at least some hundred thousand dollars only to create pools. Building cages in water in Central or South America can reach around one million or even more.
Fish Farming: Costs and How Much You Can Earn
For internal farming one needs even more capital, almost three to four millions of dollars to reach useful size.
Even a small Fish Farm can produce around 2000 pounds of fish monthly. That can cause almost 168,000 dollars yearly with margin of Profitability around 40 percent. The setup and food expenses for such small unit range between 4900 and 12,600 dollars.
When a farm reaches full operation, lucky owners can earn between 350,000 and 25 millions of dollars yearly.
Tilapia ranks between the most popular fishes for farming. The world need for it stays strong, and it grows quickly, what works for small businesses that want to commonly receive income. The costs to produce tilapia average between 1,50 and 2,00 dollars per pound.
Tilapia bear many children, and those children eat mutually early, so the nutrition stays cheap at first. Buying fish food in big crowds, one does not pay too much.
Standards in the industry show that margins of profit for fish farming usually sit between 10 and 30 percent. Farms that apply better practices commonly reach real advantages. Lower expenses for nutrition and more skill in methods can add more then 15,000 dollars of extra profit for farms of average 7.5 acres.
Growers by means of system of pond pools succeeded to pass 12,000 pounds of catfish each acre, what doubles the usual amounts.
Here the main controlled expenses are built in. Here as: rent, heating and cooling of buildings, wasted fish food and extra work… Everything this eats from the income.
It is not possible to escape some needed works, as nutrition, attention of the fish stock and general attention to the fishes. The effort to improve must span the first difficult years, and that probably is themost extra part of the whole cause.
The most yielding fish farming businesses are those that breed and sell fancy fishes. For eating fish so the secret sits in picking species that easily lives in basins, pools or sea cages. Fishes that eat cheap industrial food cost less to feed.
Most many Indian and Chinese fish species are plant eaters, what helps to keep food expenses below. Fish farming continuously grows, when natural fish populations decline and need in seafood grows.