📡 Fish Finder Frequency Calculator
Select the optimal sonar frequency for your water depth, species & fishing scenario
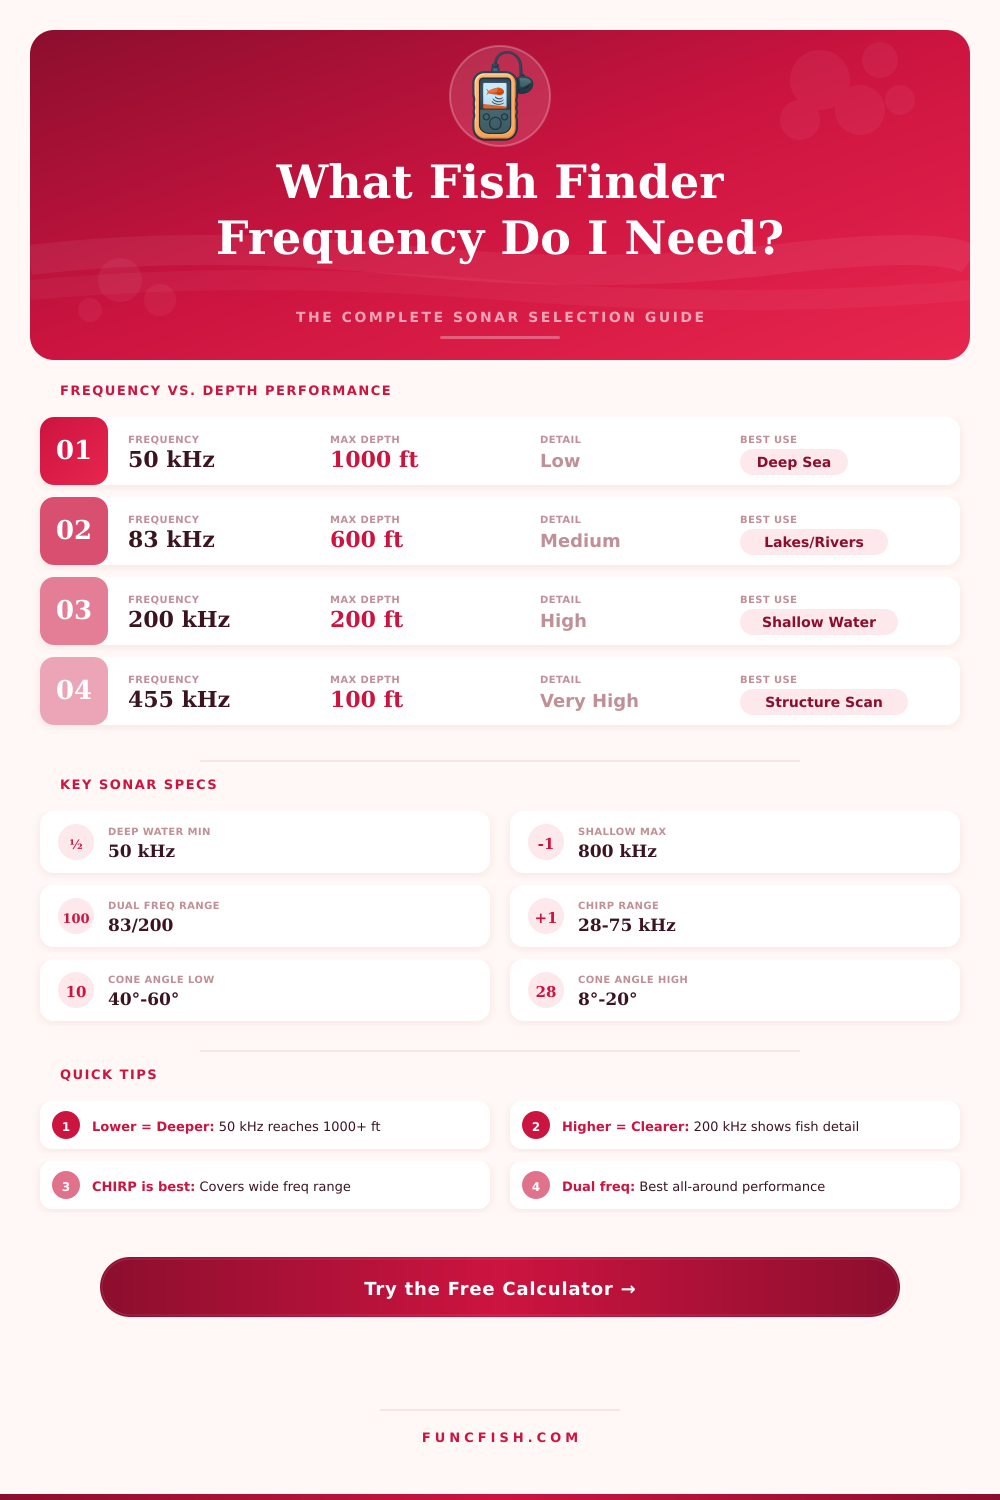
| Frequency | Max Effective Depth (ft) | Max Depth (m) | Cone Angle | Detail Level | Best Application |
|---|---|---|---|---|---|
| 50 kHz | 1,000+ ft | 305+ m | 40°–60° | Low | Deep sea, offshore trolling |
| 83 kHz | 600 ft | 183 m | 55°–60° | Low–Med | Freshwater lakes, wide coverage |
| 200 kHz | 200 ft | 61 m | 10°–20° | High | Shallow water, precise detail |
| 455 kHz | 100 ft | 30 m | 25° (side) | Very High | Side imaging, structure scan |
| 800 kHz | 50 ft | 15 m | 10° (side) | Ultra High | MEGA imaging, dock fishing |
| CHIRP Low (28–75) | 1,000+ ft | 305+ m | 40°–60° | High | Deep water with clarity |
| CHIRP Med (80–160) | 500 ft | 152 m | 15°–25° | Very High | All-purpose lakes & coastal |
| CHIRP High (150–240) | 200 ft | 61 m | 8°–16° | Ultra High | Shallow precision scanning |
| Species | Typical Depth Range | Recommended Freq | Cone Preference | Notes |
|---|---|---|---|---|
| Largemouth Bass | 5–30 ft (1.5–9 m) | 200 kHz / Dual | Narrow–Medium | Structure oriented, high detail needed |
| Walleye | 15–60 ft (4.5–18 m) | 83/200 Dual or CHIRP Med | Medium | Suspend mid-column; CHIRP preferred |
| Crappie / Panfish | 5–25 ft (1.5–7.6 m) | 200 kHz / 455 kHz | Narrow | Tight schools; high resolution |
| Trout (lake) | 20–80 ft (6–24 m) | 200 kHz / CHIRP Med | Narrow–Medium | Thermocline detection important |
| Catfish | 10–50 ft (3–15 m) | 83 kHz / Dual | Wide | Bottom huggers; wide cone helps |
| Pike / Muskie | 5–40 ft (1.5–12 m) | 200 kHz / Dual | Medium | Weed edges; structure detail key |
| Salmon (coastal) | 50–200 ft (15–61 m) | CHIRP Low / 83 kHz | Medium–Wide | Depth & thermocline tracking |
| Tuna / Offshore | 100–600 ft (30–183 m) | 50 kHz / CHIRP Low | Wide | Deep pelagic; max penetration |
| Striped Bass | 10–80 ft (3–24 m) | CHIRP Med / Dual | Medium | Current and structure orientated |
| Redfish / Flounder | 2–20 ft (0.6–6 m) | 200 kHz / 455 kHz | Narrow | Shallow flats; high detail needed |
| Power (RMS Watts) | Peak Power (W) | Max Depth (ft) | Max Depth (m) | Application |
|---|---|---|---|---|
| 50W RMS | 400W peak | 200 ft | 61 m | Entry-level / shallow |
| 150W RMS | 1,200W peak | 400 ft | 122 m | Mid-range freshwater |
| 300W RMS | 2,400W peak | 600 ft | 183 m | Coastal / all-purpose |
| 500W RMS | 4,000W peak | 800 ft | 244 m | Offshore / deep water |
| 1,000W RMS | 8,000W peak | 1,200 ft | 366 m | Deep sea fishing |
| 2,000W RMS | 16,000W peak | 2,000+ ft | 610+ m | Commercial / extreme deep |
Sonar frequency selection are important for fish finders because teh frequency of the sonar signal determine how the fish finder displays information on an screen. Sonar frequencies can be high or low. Each of these frequency has different properties related to its range and resolution.
Range is the depth at which the sonar signal can travels. Resolution is the detail of that signal that is displayed on the screen. Low frequencies can travel deeper into the water than high frequencies.
How to Choose the Right Sonar Frequency for Your Fish Finder
However, low frequencies provides less details of the images that is displayed on the screen. Low frequencies is appropriate for viewing large area of water. High frequencies provide more detailed to the screens but do not travel as deep into the water then the low frequencies.
Additionally, high frequencies can lose strength in deep water. The clarity of the water can impact how the sonar frequencies works. In clear water, high frequencies work best because there is little particulate matter in the water.
However, in muddy or stained water, fishermen use low frequencies instead because they have broader cones for the sonar signal to travel through a murky water. The speed at which the boat is traveling also has an impact on the frequencies that is used. At higher speed, the sonar signal can smear on the screen.
Therefore, the boat speed will impact which frequencies are use. The type of fish that is being targeted impact the types of sonar frequencies that are used. For example, if catfish are to be targeted, the sonar frequencies can be set to reach deep into the water to the bottom where the catfish live.
If ice jigging for crappie is occurring, anglers will use high frequencies so that the small movement of the small crappie can be targeted. Additionally, the type of bottom of the water can change the type of sonar frequency. For instance, rocky bottoms will allow for high frequencies to target the edge of the rocks but sand flats dont require the same level of detail.
The type of transducer that is used also impact the types of sonar frequencies that are used. For example, if a transducer that is mount on a planing hull is using the sonar frequencies, the boat should be traveling at slow speeds with the balance sonar bands. Live sonar pods is effective at allowing the sonar signal to scan vertically but the signal will quickly lose its range.
Side-imaging transducer should use the bands for imaging because these transducers are for imaging rather than using classic 2D cone to scan the water. Each situation require a different type of sonar frequency. Most fish finder units has the ability to use different types of sonar frequencies.
These different band can be toggled depending off the depth of the water, the speed of the boat, and the clarity of the water. By understanding the environment in which the fish finder is being used, you’ll select the appropriate sonar frequencies so that the screen will display the most accurately image of the fish and the structure in the water.