Fish Length Frequency Distribution Calculator
Turn a survey sample into equal length classes, estimated counts, cumulative frequency, proportional stock density, legal-size percentage, and a readable size-structure summary.
📌Survey presets
⚙Length frequency inputs
Length frequency results
Calculation breakdown
📊Generated frequency tables
| Length class | Midpoint | Estimated count | Frequency | Cumulative | Histogram |
|---|---|---|---|---|---|
| Run the calculator to build the length frequency table. | |||||
| Size group | Length rule | Estimated fish | Sample percent | Interpretation |
|---|---|---|---|---|
| Size-group results appear after calculation. | ||||
🎣Survey method data grid
Electrofishing
Trap / Fyke Net
Gill Net
Creel / Log
📘Reference tables
| Species | Stock length | Quality length | Preferred length | PSD note |
|---|---|---|---|---|
| Largemouth bass | 8 in / 20 cm | 12 in / 30 cm | 15 in / 38 cm | PSD 40-70 is often balanced |
| Smallmouth bass | 7 in / 18 cm | 11 in / 28 cm | 14 in / 36 cm | Higher PSD can signal older adults |
| Bluegill / sunfish | 3 in / 8 cm | 6 in / 15 cm | 8 in / 20 cm | Low PSD can show crowding |
| Crappie | 5 in / 13 cm | 8 in / 20 cm | 10 in / 25 cm | Year-class strength changes quickly |
| Walleye | 10 in / 25 cm | 15 in / 38 cm | 20 in / 51 cm | Gill nets need mesh-bias caution |
| Northern pike | 14 in / 36 cm | 21 in / 53 cm | 28 in / 71 cm | Large-fish tail is management-sensitive |
| Indicator | Formula | Good sample practice | Common caution |
|---|---|---|---|
| Class frequency | Class count / sample count | Use equal class widths | Unequal bins distort the shape |
| Cumulative percent | Running count / sample count | Read from smallest to largest | Rounded counts may end at 99-101% |
| PSD | Quality and larger / stock and larger x 100 | Use accepted species thresholds | Exclude fish below stock length |
| Target-size percent | Fish at target length / sample count | Choose a biological or harvest threshold | Creel data often overstates it |
| Recruitment pulse | Fish below stock length / sample count | Compare same gear and season | Small gear can inflate young fish |
⚖Comparison grid
Fine bins
Best when many fish were measured and you need cohort detail across tight size breaks.
0.5-1 inStandard bins
Good default for most warmwater samples because bars remain readable and comparable.
Coarse bins
Helpful for small samples, broad creel summaries, or large-bodied fish with wide ranges.
2-5 inPSD view
Condenses the distribution into stock, quality, preferred, memorable, and trophy signals.
💡Practical notes
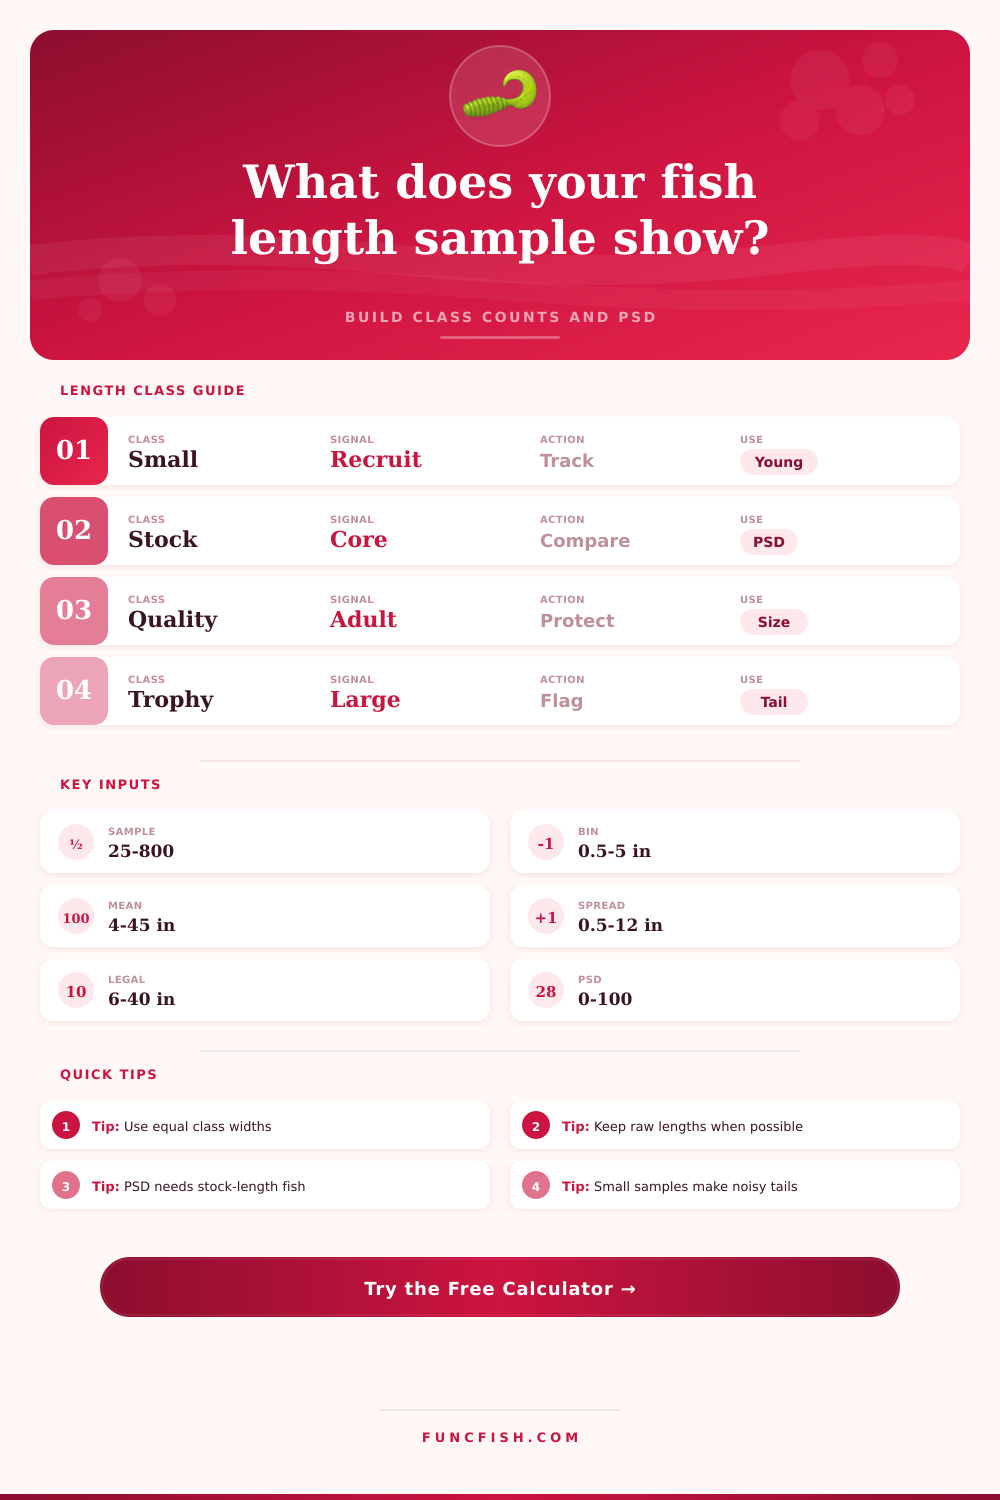
Compare like with like. Length frequency is strongest when the same gear, season, waterbody zone, and measurement rules are used across surveys.
Keep class widths consistent. If you change from 1-inch to 2-inch classes, rebuild past tables before comparing modes, tails, or PSD trends.
“Here’s what you’ve got: You’re holding a clipboard with a hundred fifty bass lengths on it. They blur into one another, and then you sort them out. And then that’s when the work starts, raw measurements aren’t any good; they’re just noise without some kind of organization. This thing takes that chaos and organizes it in length classes. It calculates proportional stock density so you can look at your data and know what the heck it’s telling you rather than gazing at a column of numbers and trying to guess at its patterns. It transforms a pile of measurements into a map of the population.
This map tells you where the weight is and if these fish is growing or just multiplying. Your starting point here is the width of the class. This will determine the readability of your results. For most warm water species, a one-inch bin is good. It should be wide enough to distinguish different year classes without making a jagged histogram that looks like a static-filled TV screen.
How to Organize Fish Data
Make your bins too small and each measurement error will spawn a new category. Make them too large and you smear out the variation among age class. Once you enter that parameter into the tool, it do the math for you. It spreads your counts evenly in an interval so you can see what visual representation of the population looks like. Basically, you’re determining the way you’ll view the fishery. Precision isn’t as important than clarity when looking for trends.
From there, the resulting distribution shows the battle between survival and recruitment. Overcrowding is signaled by a heavy tail of small fish. However, to an angler seeking action, this may appear as a success. These recruits fight for scarce resources. That competition stunts their growth. They don’t reach keeper size. Separating quality from quantity is where proportional stock density comes into play.
It measures the percentage of both: stock-sized fish AND fish above some quality threshold. Sub-stock juveniles are totally ignored. If your big fish are all four-inch stunts, five-hundred bass sounds much less appealing than fifty. Management goals dictate legal size thresholds, which is not purely biological; they introduce a new level of interpretation. A slot limit changes the shape of the distribution because it allow you to harvest the largest and smallest fish while protecting the ones in the middle.
The calculator will account for those rules by assuming some portion of your sample are in the protected and harvestable categories. For example, you might use our walleye or largemouth bass benchmarks to compare your survey results. That comparison then tells you whether your local population meet healthy standards. If your score is low, either growth conditions aren’t good or there’s been lots of fishing pressure. If your score is high, that typically means a balanced and mature system where adults gets time to grow up into quality sizes.
The silent killer in any analysis is sampling bias, each type of gear doesn’t catch all fish equally. Electrofishing prefers shoreline cover. Trap nets are targeted at spawning adults. Mesh selection determines the size range that gill nets catches. So if you compare a gill net survey this year to an electrofishing survey last year, no matter how accurate your calculator may be, your conclusion will still be flawed. To track actual changes over time, keep your methods consistent.
These species-specific details is laid out in the reference tables so that you can adjust your expectations based off how the data was gathered. All-in-all, it’s all about turning work into knowledge because counting fish without context is nothing more than boring paperwork. When you break that frequency distribution down and use some standard density measures, you’re not just counting fish anymore, you’re actualy assessing the health of the ecosystem.
At what points did year classes survive? Was there a drought? Did they make it through the winter? Are the fish growing at the same rate as they are being added to the population? There is a lot to get lost in the math side of things, but the point has never changed: Do you have a thriving fishery or do you just have an existing one? The structure of your length frequencies will tell you everything long before you ever pick up a fishing rod.”