Fish Mercury Calculator
Estimate mercury exposure from species ppm, edible portion weight, weekly servings, body weight, reference threshold, source confidence, and edible yield.
① Species Mercury Presets
② Exposure Inputs
Mercury Exposure Math
Full Calculation Breakdown
③ Mercury Reference Cards
ppm Conversion
Imperial Portion
Body Weight
Yield Factor
④ Reference Tables
| Species Preset | Mercury ppm | 4 oz Edible Mercury | 6 oz Edible Mercury |
|---|---|---|---|
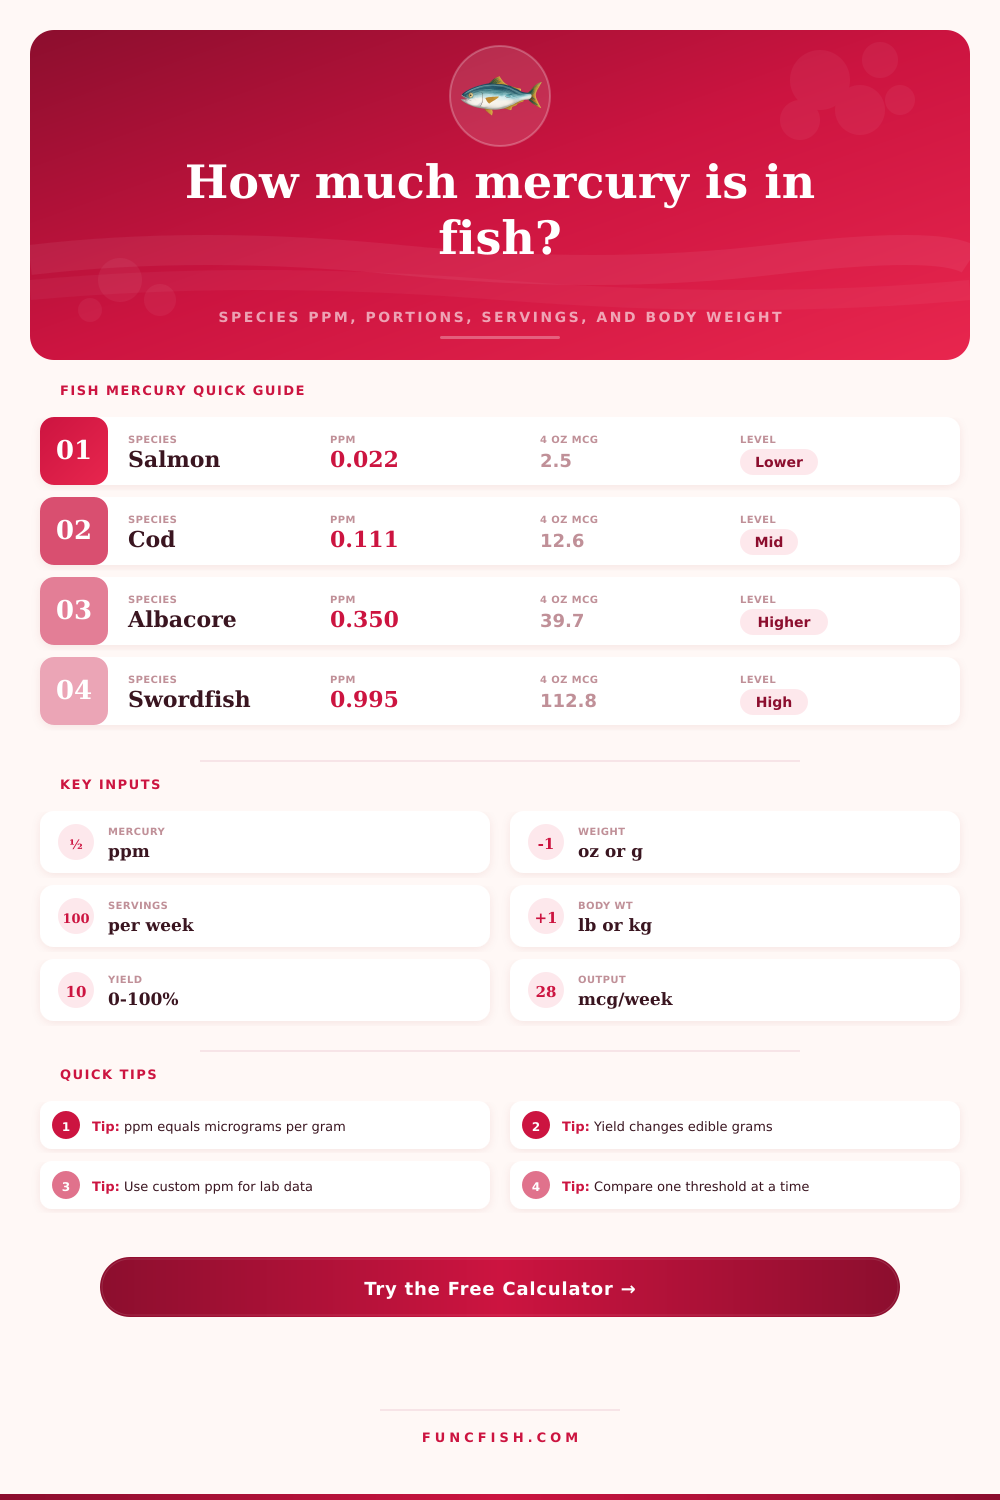
| Atlantic salmon | 0.022 ppm | 2.5 mcg | 3.7 mcg |
| Tilapia | 0.013 ppm | 1.5 mcg | 2.2 mcg |
| Cod | 0.111 ppm | 12.6 mcg | 18.9 mcg |
| Canned light tuna | 0.126 ppm | 14.3 mcg | 21.4 mcg |
| Albacore tuna | 0.350 ppm | 39.7 mcg | 59.5 mcg |
| Mahi mahi | 0.178 ppm | 20.2 mcg | 30.3 mcg |
| Halibut | 0.241 ppm | 27.3 mcg | 41.0 mcg |
| Swordfish | 0.995 ppm | 112.8 mcg | 169.3 mcg |
| King mackerel | 0.730 ppm | 82.8 mcg | 124.2 mcg |
| Shark | 0.979 ppm | 111.0 mcg | 166.5 mcg |
| Reference Threshold | Value | Calculator Use | Percent Formula |
|---|---|---|---|
| Weekly reference A | 0.7 mcg/kg/week | Strict comparison option | Exposure / 0.7 x 100 |
| Weekly reference B | 1.6 mcg/kg/week | Mid comparison option | Exposure / 1.6 x 100 |
| Weekly reference C | 3.3 mcg/kg/week | Broad comparison option | Exposure / 3.3 x 100 |
| Custom reference | User entered | Manual comparison option | Exposure / custom x 100 |
| Input | Imperial Mode | Metric Mode | Internal Unit |
|---|---|---|---|
| Portion weight | ounces per serving | grams per serving | grams |
| Body weight | pounds | kilograms | kilograms |
| Mercury concentration | ppm | ppm | mcg per gram |
| Edible yield | percent | percent | decimal factor |
| Serving frequency | servings per week | servings per week | weekly count |
| Source Confidence | Band | Lower Range | Upper Range |
|---|---|---|---|
| High confidence | +/- 10% | Result x 0.90 | Result x 1.10 |
| Medium confidence | +/- 25% | Result x 0.75 | Result x 1.25 |
| Screening estimate | +/- 50% | Result x 0.50 | Result x 1.50 |
| Exact entered value | No band | Result x 1.00 | Result x 1.00 |
⑤ Species Comparison Grid
Salmon
Lower preset concentration for comparison arithmetic.
Tilapia
Low preset value for light exposure examples.
Cod
Mid-low white fish preset for portion math.
Light Tuna
Canned tuna preset with a moderate reference ppm.
Albacore
Higher tuna preset for comparison scenarios.
Mahi Mahi
Moderate pelagic fish preset for fillet entries.
Halibut
Steak-style portion preset with medium ppm.
Swordfish
High concentration preset for interval math.
King Mackerel
High concentration preset for weekly percent checks.
Shark
High concentration preset for custom scenarios.
⑥ Calculation Notes
Unit tip: ppm is already micrograms per gram, so the main conversion step is turning the entered portion into edible grams.
Reference tip: the percent card divides weekly mcg/kg/week by the selected threshold and shows only the arithmetic comparison.
Mercury are a substance that is found in fish, as well as a substance that can build up in the human body over time. Mercury enter the ocean through industrial pollution, but eventually find its way into the food chain through a process known as bioaccumulation. Plankton contain mercury, but small fish eat the plankton, and the larger fish that eat the small fish contains more mercury due to the fact that the small fish are eating much amounts of the plankton with mercury.
Thus, the larger the fish and the more predatory the fish are, the more mercury that is contained within its flesh, swordfish and shark contains more mercury than fish like salmon or tilapia. The amount of mercury that is contained in fish can be measured in a unit called parts per million (ppm). Ppm is a unit that express the amount of micrograms of mercury contained in every gram of flesh from the fish.
Mercury in Fish and How to Eat Fish Safely
For instance, tilapia contains 0.013 ppm of mercury, but swordfish contains nearly 1.0 ppm. Since the ppm level of mercury are different for each type of fish, the total amount of mercury that a person consume from the fish is the ppm of the fish multiplied by the portion size of the fish that is consumed. The portion size of the fish that is consumed is another factor that must be consider to calculate the total amount of mercury that an individual consumes.
The portion size of fish can be adjusted for the edible yield of the fish. Edible yield is the weight of the fish after the skin and bones is removed. Thus, if the portion size is measured from a fish that contain bones, the portion size will be larger than the amount of fish that is edible and consume by the individual.
Additionally, the body weight of the individual must also be considered in the calculation of mercury consumption. Mercury consumption is measured in the total amount of micrograms of mercury per kilogram of body weight. Thus, an adult whose body weighs more kilograms than a child can consume more micrograms of mercury before it becomes detrimental to their health then the child’s body.
There are threshold for mercury consumption established by various health agencies. These thresholds are established in the amount of micrograms of mercury per kilogram of body weight per week. These thresholds for each individual group of peoples vary due to the different sensitivities of each group to mercury.
For instance, pregnant individuals and children has lower limits for mercury consumption than adults, as mercury can impact the neurodevelopment of the brain in young individuals. These thresholds can be incorporated into calculation tools to determine how much of a specific type of fish an individual should consume. If the amount of mercury calculated from a portion of fish is over 100% of the threshold for that individual’s body weight and age, then the individual should consume less of that type of fish to ensure that the body is not exposed to to much mercury.
Mercury consumption can be reduced by incorporating various types of fish into one’s diet. Consuming the same type of fish every day can lead to the body accumulate mercury at a rapid rate. By consuming many different types of fish each day, such as cod or mahi-mahi, an individual can consume the beneficial nutrient from fish while avoiding the detrimental effects of high amounts of mercury.
Many individuals makes the mistake of thinking that all types of tuna contain the same amount of mercury. However, albacore tuna contain more mercury than light tuna. Additionally, the methods used to cook the fish can alter the weight of the fish.
For instance, when fish is grilled or baked, the water in the flesh can evaporate from the flesh, increasing the ppm of mercury that is present in the consumed fish. Overall, fish contain beneficial nutrients for the human body, but also contains mercury. The risks associated with mercury can be avoided by understanding the ppm level of the various types of fish, calculating the portion size of the fish, and avoiding fish with high levels of ppm.
By using these mathematical calculations to determine how often an individual eats fish, that individual can enjoy the benefit of fish in the diet while maintaining safe limits of mercury consumption.