Fish Relative Stock Density Calculator
Convert fisheries length-frequency counts into PSD, RSD-P, RSD-M, RSD-T, stock structure status, and sample confidence notes.
📌Survey presets
⚙Stock density inputs
Relative stock density results
Calculation breakdown
📏Current length class gates
Minimum fish counted in the RSD denominator.
Quality numerator for PSD.
Preferred-size numerator for RSD-P.
Upper-size density gates for older fish.
📊Structure comparison grid
Many stock-length fish but fewer quality fish. Growth, forage, or harvest context usually matters.
Quality fish are present without losing the smaller stock-size base needed for continuity.
High quality proportion. Check recruitment before calling it a strong trophy trend.
Very high quality share. This can be desirable, selective, or a sign of weak young fish sampling.
📚Reference tables
| Species | Stock | Quality | Preferred | Memorable | Trophy |
|---|---|---|---|---|---|
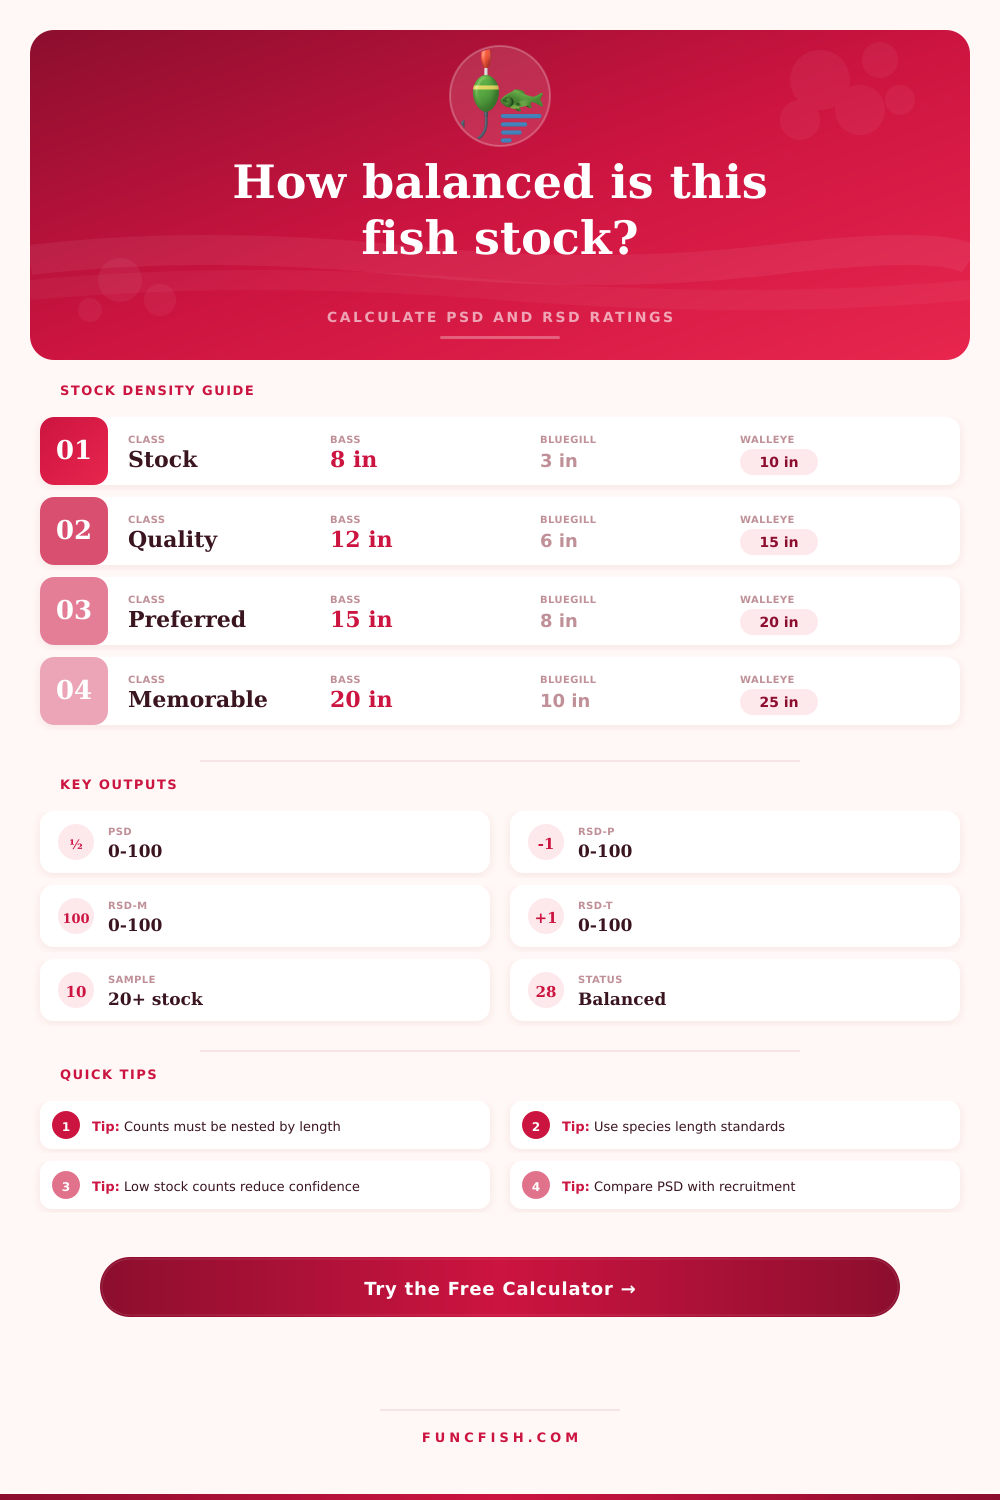
| Largemouth bass | 8 in / 20 cm | 12 in / 30 cm | 15 in / 38 cm | 20 in / 51 cm | 25 in / 64 cm |
| Smallmouth bass | 7 in / 18 cm | 11 in / 28 cm | 14 in / 36 cm | 17 in / 43 cm | 20 in / 51 cm |
| Bluegill | 3 in / 8 cm | 6 in / 15 cm | 8 in / 20 cm | 10 in / 25 cm | 12 in / 30 cm |
| Black crappie | 5 in / 13 cm | 8 in / 20 cm | 10 in / 25 cm | 12 in / 30 cm | 15 in / 38 cm |
| Walleye | 10 in / 25 cm | 15 in / 38 cm | 20 in / 51 cm | 25 in / 64 cm | 30 in / 76 cm |
| Channel catfish | 11 in / 28 cm | 16 in / 41 cm | 24 in / 61 cm | 28 in / 71 cm | 36 in / 91 cm |
| Northern pike | 14 in / 36 cm | 21 in / 53 cm | 28 in / 71 cm | 34 in / 86 cm | 44 in / 112 cm |
| Yellow perch | 5 in / 13 cm | 8 in / 20 cm | 10 in / 25 cm | 12 in / 30 cm | 15 in / 38 cm |
| Metric | Formula | Numerator | Denominator | Use in stock review |
|---|---|---|---|---|
| PSD | Quality / stock x 100 | Fish at quality length or longer | Fish at stock length or longer | Overall quality-size share |
| RSD-P | Preferred / stock x 100 | Fish at preferred length or longer | Fish at stock length or longer | Desirable larger fish signal |
| RSD-M | Memorable / stock x 100 | Fish at memorable length or longer | Fish at stock length or longer | Older large fish presence |
| RSD-T | Trophy / stock x 100 | Fish at trophy length or longer | Fish at stock length or longer | Exceptional upper-end density |
| PSD band | Structure read | RSD-P clue | Recruitment clue | Interpretation caution |
|---|---|---|---|---|
| 0-20 | Very small-fish heavy | Usually low | Often strong or crowded | Check forage and growth before judging harvest |
| 20-35 | Young or crowded | Low to modest | Strong to steady | May be normal after a strong year class |
| 35-60 | Balanced | Moderate | Steady | Common target range for many sport fisheries |
| 60-80 | Quality-size skew | Moderate to high | Watch young fish | Can reflect good growth or gear selectivity |
| 80-100 | Large-fish heavy | High if preferred fish remain common | Often weak or undersampled | Validate with age, recruitment, and method mix |
| Sample method | Typical size bias | Best use | Confidence note | RSD caution |
|---|---|---|---|---|
| Boat electrofishing | Shoreline and cover fish | Bass and sunfish indexes | Good when stations are repeatable | Open-water adults may be underrepresented |
| Backpack electrofishing | Reach-scale shallow fish | Stream bass and trout-size work | Strong for short reaches | Deep pools can hide larger fish |
| Fyke or trap net | Moving or spawning fish | Crappie, perch, and panfish | Useful with net-night effort | Season timing can strongly change PSD |
| Gill net panel | Mesh-size selective | Walleye, pike, and open-water species | Compare similar mesh sets | Do not mix unlike meshes casually |
| Seine haul | Small fish and young cohorts | Recruitment context | Good for young fish signal | Usually not a full adult RSD sample |
| Angler log or creel | Harvestable fish | Supplemental trend notes | Useful when effort is recorded | Large-fish memories inflate structure |
💡Calculation tips
Stock density relative to length is another way of saying that if you’re used to measuring things, then the lack of correlation between your measures and catch tells you something about a change in the fishery. It allows for removal of noise in populations and concentration on structure; namely, what type of fish are there versus how many? By using the math, we let the calculator do that work for us in the box above and concentrate on interpreting results.
The Percentage of Stock that are Quality (PSD) is the core metric. It is the percentage of your total stock over a certain minimum length that is quality. In other words, how much of your larger, more desirabel fish are there compared to smaller ones? If PSD is high, there’s likely plenty of food and good growth rates. On the other hand, if PSD is low, too many mouths exists competing for scarce resources; this usually indicates overcrowding. To understand PSD properly, you must know what’s driving it in your particular water body.
How to Read Fish Data
And be careful about defining your lengths, they range wildly by species. A 12 inch bluegill is a dinner plate; an eight inch bass is barely a fingerling. The calculator defaults to common game fish and their standard presets, giving you a place to start with biologically relevant cutoffs. Setting the wrong stock length alters the baseline and skews all subsequent ratios. If you set the bar too low, you dilute quality signal. If you set it too high, you create artificial scarcity that looks like a trophy fishery when it is actualy just empty.
We recruit, but people don’t realize how much recruitment matters. You can have a pond full of little guys one year and an empty pond the next. Changes in recruitment are what you divide by in your RSD equations. One night you have a different number to work with. Because of context, we want to be sure and ask about recent recruitment signals to avoid misdiagnoses. Normal strong year classes depress PSD values for awhile. That’s not always bad because sometimes that means good reproduction and the population will hold up just fine in five years. But if we ignore this, we subject the population to too much harvest pressure in the midst of a normal biological cycle.
Your gear also distorts your data. A seine haul will capture only the juveniles while completely missing adults, and the electrofishers won’t pull the big bass lurking out there in the deep open water near shore. By recording what type of gear you used, you can account for those blind spots in your mind with the calculator. Because the gear does affect which fish show up, it’s important to take that into account when interpreting results. Trusting the number without knowing about the net is a dangerous habit. Don’t get too excited about a high RSD-P from a gill net sample, as it could be mesh size bias different than true abundance.
The numbers don’t tell the whole story; it’s the comparison that makes them matter. PSD shows the base quality. RSD-P adds another layer by showing presence of preferred size. RSD-M & T show that larger sizes is present. They provide a picture of trophy potential by tracking those larger sizes. All these metrics put together paint the picture of survival and retention. It tells whether the fish are surviving long enough to get big.
On the page, the structure comparison grid lays it all out there in bands for you. These are grouped into crowded, skewed, and balanced categories. This helps you avoid making decisions based off the feeling of a single number. For example, a 45 may look average, but it could be a perfect example of balanced for that specific ecosystem.
The expectation is also shaped by water type. Volume-based productivity will cause different PSD values in reservoirs compared to small ponds. Similarly, streams aren’t dependent upon huge growth spurts; they depend upon consistent recruitment. Your management objective defines your idea of success. A trophy-oriented lake requires a high RSD-T value, while a more balanced family fishery prioritizes moderate RSD-P and consistent PSD. Understanding your goal keeps you focused on the right numbers because different systems demand different targets.
Any result has less confidence when sample size is low. The calculator protects you against being too confident with small samples by flagging it automatically… Twenty fish don’t warrant complex structural analysis. A small sample is a snapshot, not a panorama. It is good for trends over time, but not for absolute judgments alone. Consistency is more important then precision when we are short on resources.
Putting it all together is the final read. So combine the density ratios with your local knowledge of growth rates and angler pressure. If it’s a high PSD with weak recruitment then it has an aging population that’ll collapse soon. And if it’s a low PSD with strong recruitment, then it’s got a temporary surplus of young fish instead. The math is in the calculator, now you add the judgment.
That’s where raw data becomes actionable insight by understanding what it is that you’re really measuring. You don’t just see counts anymore. You start to see the health of the system behind them. That change in perspective shifts not only how you fish, but how you manage as well.