Fish Tagging Recapture Estimate Calculator
Estimate a closed fish population from tagging and recapture counts, with adjusted marked fish at large, confidence range, recapture strength, density, and sample-size guidance.
📌Tagging study presets
⚙Mark-recapture inputs
Population and recapture forecast
Calculation breakdown
📊Estimator comparison grid
Chapman
Low-bias closed-population estimate for small recapture counts.
Bailey
Adjusted denominator useful when recaptures are limited.
Naive Ratio
Simple M times C divided by R, most sensitive to low R.
Pooled Check
Uses prior marked fish as a rough Schnabel-style comparison.
🏷Tag and study quality data
PIT tag
T-bar tag
Fin clip
Coded wire
📘Reference tables
| Estimator | Formula | Best fit | Main caution |
|---|---|---|---|
| Chapman corrected | ((M+1)(C+1)/(R+1))-1 | Single closed recapture event | Assumes equal catchability |
| Bailey adjusted | M(C+1)/(R+1) | Low recapture count | Still sensitive when R is tiny |
| Simple Petersen | MC/R | Large R, clean mixing | Biased high when R is small |
| Schnabel-style pooled | sum(CM)/sum(R) | Repeated survey context | Needs consistent effort |
| Density check | N/area | Comparing habitats | Area boundary must be real |
| Species group | Movement tendency | Mixing window | Sampling note |
|---|---|---|---|
| Bass / panfish | Home range patches | 3-14 days | Rotate shoreline and cover zones |
| Trout / salmonid | Reach oriented | 1-10 days | Respect barriers and flow pulses |
| Walleye | Basin and structure shifts | 7-30 days | Sample day/night if behavior differs |
| Catfish | Channel and hole use | 7-21 days | Repeat baited gears carefully |
| Reef fish | Site attached to mobile | 14-45 days | Spread effort across reef sectors |
| Recaptures | Estimate strength | Interval behavior | Field response |
|---|---|---|---|
| 1-4 marked fish | Very weak | Extremely wide | Run another sample before relying on N |
| 5-14 marked fish | Screening estimate | Wide | Report uncertainty prominently |
| 15-49 marked fish | Useful estimate | Moderate | Compare methods and assumptions |
| 50-149 marked fish | Strong estimate | Narrower | Check bias and area closure |
| 150+ marked fish | Very strong | Stable | Look for stratified differences |
| Bias source | Effect on estimate | Calculator input | Interpretation |
|---|---|---|---|
| Tag shedding | Inflates N if ignored | Tag retention | Lower retention reduces M at large |
| Tag mortality | Inflates N if ignored | Mortality/removal | Dead or removed tagged fish leave M |
| Trap happy fish | Deflates N | Capture bias | Recaptures are too frequent |
| Trap shy fish | Inflates N | Capture bias | Recaptures are too rare |
| Open population | Unstable N | Mixing quality | Wide intervals need cautious use |
💡Calculation tips
Match the boundary to the fish. A closed mark-recapture estimate only behaves well when tagged fish and untagged fish share the same practical sampling area.
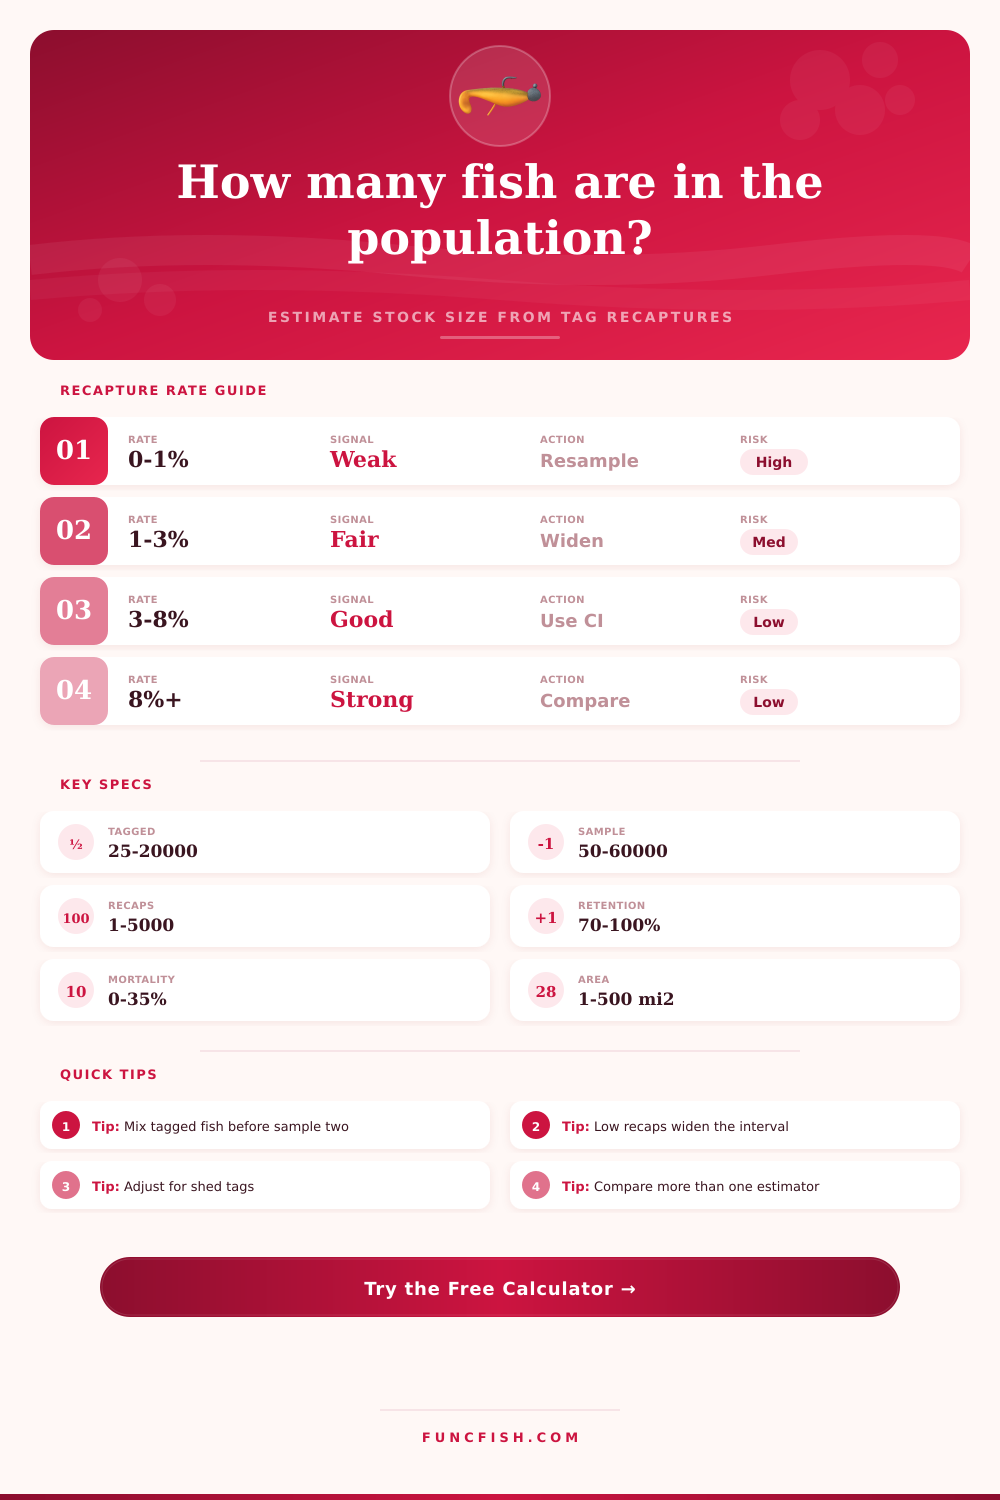
Treat tiny R as a warning. If recaptures are scarce, the estimate is driven by one or two fish; increase the second sample or mark more fish.
This method are called mark-recapture. By using this method, it’s possible to estimate the size of a fish population without having to count each one. How does it work? Simply put, you capture a sample, tag them, and put them back. They will mix with untagged fish and later you’ll take another sample.
Based off the percentage of tagged fish that you find in the second sample, you can estimate the percentage of tagged fish that are in the whole lake. For example, if ten percent of your second sample are tagged, you know there’s about ten percent of population in the lake that are also tagged. Why? Random sampling evens things out over time. If the population is closed throughout the study (it won’t gain or lose members) and your sample is random, then you don’t have to have a complete census to obtain an accurate estimate.
How Mark-Recapture Works
In reality, however, this calculation are more complex. Fish aren’t static because they responds to stressors and change their behaviors. For example, if tagged fish is more susceptible to capture, then you’ll underestimate abundance. Conversely, if they evade capture, you’ll overestimate abundance. To fit these variables, the calculator let you enter mortality values and tag retention rates. Not all marked fish survives until the next survey, and some tags falls off. Failure to consider these losses will inflate estimates, making an already small population look even bigger then it really is.
With small samples, selecting an estimator are important. If very few individual are recaptured, the math behind simple Petersen ratio fails. It lacks stability and produces high variance (unreliable data), which leads to bad management decisions. To address this issue, the tool provide a Chapman correction that stabilizes the estimate in low count situations. This maintains accuracy despite poor field conditions.
If one method show drastically different results compared to another, it’s best to run both methods side-by-side. Often, a big difference simply means there was something wrong with your sampling strategy. Not the calculations. It’s the arithmetic but it is also about timing and mixing quality. Dumping those tagged fish into a thermally stratified lake will trap some of them in certain areas. This invalidates your assumptions of evenness among mixed marked and unmarked fish. Give yourself enough time to allow for the distribution to equalize from one survey to the next. But don’t give yourself too much time so that new fish comes or go out of the system. Generally, this means most folks picks a time window in which habitats are used similarly. This makes the second sample representative of similar conditions than the first.
There’s no formula for fixing a bad field design. But if you think all of your fish live out in deep water and your nets is only catching them when they’re up in the shallow weeds, your estimate will be wrong. This is because of bias in your sampling method. Confidence intervals don’t mean much if your sample wasn’t very good. Recapture strength indicators helps you understand if your results support strong conclusions. You want to make sure that the findings indicate there is a hypothesis worth pursuing.
When it’s done right, mark-recapture converts random catch records into useful conservation information. This information allows you to manage hidden populations while understanding what you can count. It should of been more naturaly explained.