Fish Year Mark Spacing Calculator
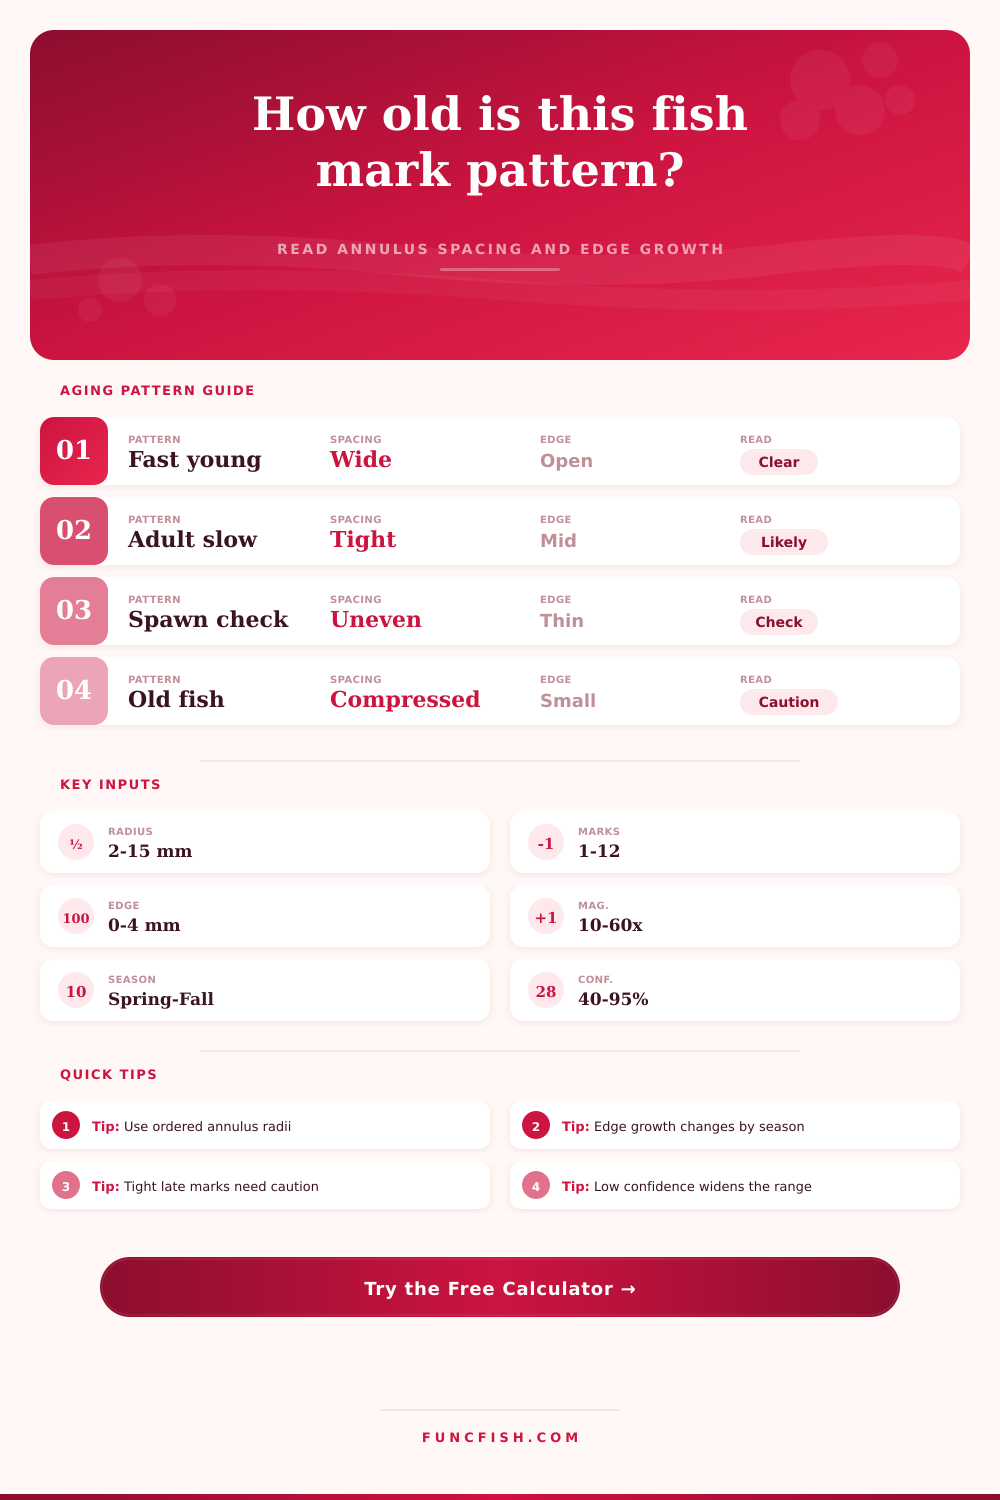
Interpret scale or otolith annulus spacing with total radius, mark radii, edge growth, magnification, species growth type, capture season, and read confidence.
📌Aging presets
⚙Year mark measurements
Enter marks in order from the focus to the edge. The calculator checks spacing, edge growth, expected seasonal margin, and measurement quality.
Age and spacing interpretation
Full breakdown
🐟Species comparison grid
Trout
Walleye
Bluegill
Catfish
📋Reference tables
| Growth type | Expected spacing curve | Edge sensitivity | Common interpretation |
|---|---|---|---|
| Short-lived fast growth | Wide first marks, quick taper | High | Edge often adds a plus class |
| Steady moderate growth | Even annual decline | Medium | Spacing ratio is stable |
| Long-lived slow growth | Compressed late increments | Low | Older marks need stronger confidence |
| Coldwater seasonal growth | Sharp winter checks | High | Season matters for edge calls |
| Migratory pulse growth | Alternating wide and narrow bands | Medium | Look for repeated pulse cycles |
| Stunted crowded growth | Small and similar increments | Low | False annuli are more likely |
| Capture season | Expected edge | Age notation | Edge caution |
|---|---|---|---|
| Early spring | Small margin after new annulus | Mark count plus 0 | Do not over-count a thin edge |
| Late spring | Growing margin | Mark count plus 0.25 | Check for fresh opaque growth |
| Summer | Moderate edge band | Mark count plus 0.5 | Edge can hide a weak annulus |
| Fall | Large completed edge | Mark count plus 0.75 | Near-next-year calls need support |
| Winter | Tight edge or forming mark | Mark count plus 1 if closed | Thin opaque bands can be checks |
| Structure | Useful radius range | Common strength | Common weakness |
|---|---|---|---|
| Scale | 2-8 mm | Fast non-lethal reads | Edge erosion in old fish |
| Whole otolith | 1-7 mm | Clear early marks | Stacked late growth |
| Sectioned otolith | 1-12 mm | Best for old fish | Needs careful center alignment |
| Fin spine / ray | 2-15 mm | Works for catfish and pike | Core resorption can remove marks |
| Quality signal | Good sign | Warning sign | Calculator effect |
|---|---|---|---|
| Annulus order | Radii increase cleanly | Duplicate or reversed mark | Score drops sharply |
| Spacing ratio | Gradual decline | Single very thin interval | Possible false check |
| Edge distance | Matches season | Too large or too tiny | Age plus class changes |
| Magnification | Structure fills field | Too low for late marks | Quality penalty applies |
💡Aging checks
Tip: If the final two increments are much smaller than the early increments, compare the edge call with capture season before adding a year.
Tip: Treat one unusually narrow interval as a possible check unless adjacent marks repeat the same seasonal spacing pattern.
It happens; you pull a scale off a largemouth bass, pin it under a microscope and see a series of faint rings. They are not so much rings as a map. And there it is, that’s when most guys freeze up. Yes, they’re rings but some are wide while others is all squeezed together and then the outside edge is blurry. Is this a check or an actual annulus? Did the fish stop growing in January or August?
The answer isn’t necessarily about counting lines. It’s about interpreting story the rings tell us. They show how food was available, what temperatures were being experienced, and what a fish’s metabolism were doing. Use this structure to help you guess less.
How to Read Fish Growth Rings
So what does the tool do? That’s where the tool above comes into play. First it asks for raw geometry of the structure. Then you tell it how far from focus the overall radius to the outside of the structure is. Then you tell it exact radius of each mark that you think is a real one. It will then calculate distance between those marks. When they get too small too fast, it flags pattern as compressed. Compressed tends to be found on old fish, or stunted populations. Consistent and wide spacing tell us the fish grew well.
And this is important because it doesn’t necessarily mean there is a full year of space in the wide gap at the outer edge. It could simply be the fish got caught in late summer before the winter slow down caused another tight cluster of dense banding. The calculator factors that out with the capture season.
The silent variable ruining most age estimates are season timing. A fish caught in early spring typically has a very small margin of edge (the last clear ring), meaning that last clear ring likely represents the previous winter’s growth. Add that margin to a full year, and there’s your inflation. A fish caught in fall will have a big cloudy edge band indicating it’s near completion of its next growth cycle. Whether this is a half-year or a whole year makes all the difference between three and three-plus. Whether you call a fish three years or three-plus is simply a matter of whether this edge is complete or just a fraction of a year. How this works seasonally is laid out in the reference table at the bottom of the page. It illustrates how the same physical edge equals varying fractions of age based off what time of year it occurs.
It also helps that structure varies the game. An old fish with a scale are hard to read because they can erode at the edge. They wear away at the edge. But the otoliths (ear stones) is far more durable, and keep track of each year’s growth. Unfortunately, they also have to be destructively sampled. Otoliths can be sectioned to show their center. However, if they are not aligned correctly, it can cause ghost rings that appear as actual rings of growth. You’ll specify the structure type in the calculator. That impacts its scoring of confidence. On a forty inch pike, the scale might be worn at the edge. The system knows that puts it at risk for erosion, and scores the reliability down accordingly. And it reminds you, a low confidence read on a scale that has been worn down isn’t the same as a low confidence read on a nice clean spine.
Clarity also depends on magnification. A good read distinguishes between temporary checks due to a momentary depletion of food supply and true annuli. Blurred detail prevents reading it; tiny viewfinder diminishes the picture. There’s a typical working zoom at which this tool assumes you’re operating. Reads with too-tight late marks are penalized because they blur beyond resolution. This is a commonsense warning that some age may be better described as an educated guess than a precise number.
This is where things get more difficult with older fish. Rings close up as they grow. Now, all of their years has compressed into a tight group on the outside. You’ll need to study hard to see the separation between the years here. That’s what the calculator is doing. Because it looks for signs of this type of ring closing. If the later rings are too closely packed compared to the earlier ones, it will alert you to take care. It will not tell you to disregard it, but just to use caution. Perhaps you’re seeing a double-year class or perhaps you’re seeing one year that spanned two growing seasons.
At the end of the day, it’s more pattern recognition than mathematics; looking for the rise and fall of time captured in protein and calcium. The measurements help you read that tune. They tell you what to expect biologically. And if season, edge and spacing all fall into place, bingo. There’s the age. If not, you’re on notice to dig deeper. Because age isn’t just about a number, but offers insight into life of the fish.