Tackle Inventory Value Calculator
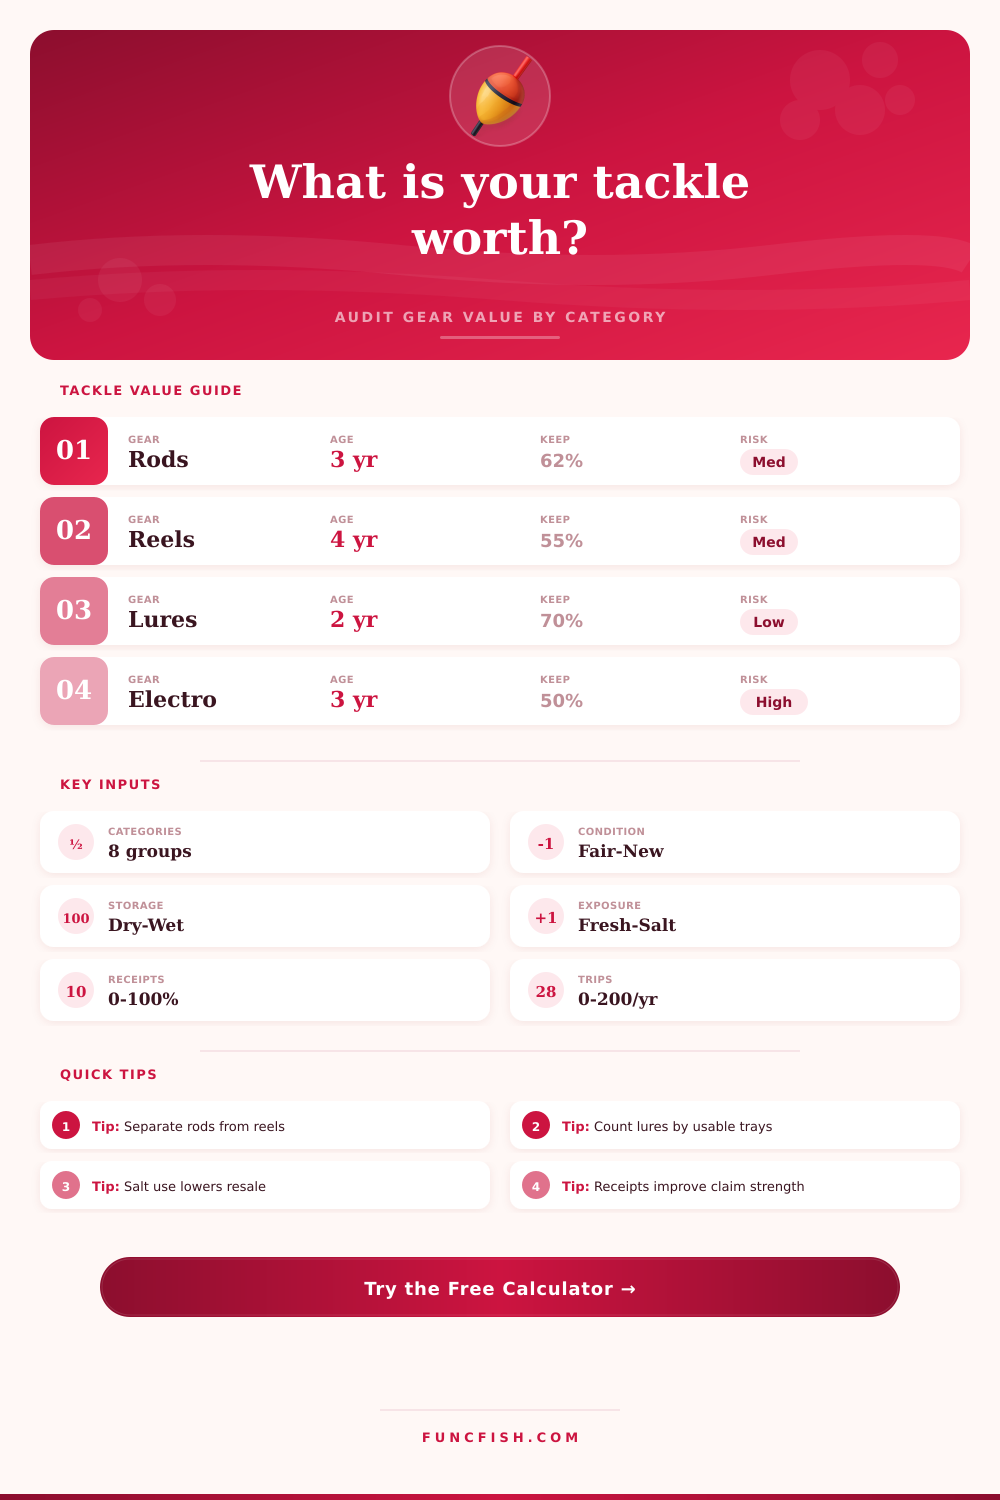
Estimate current value, replacement value, depreciation, and claim readiness across rods, reels, lures, electronics, terminal tackle, line, storage, and tools.
📌Scenario presets
⚙Inventory settings
🧰Tackle category audit
Rods
Reels
Lures and flies
Terminal tackle
Line and leaders
Electronics
Bags and boxes
Tools and accessories
Tackle value forecast
Full breakdown
📋Category retention grid
Rods
Reels
Lures
Electronics
📊Valuation reference table
| Category | Typical retained value after 3 years | Best inventory unit | Why it changes |
|---|---|---|---|
| Rods | 58% to 72% | Each rod by length and power | Guide wear, blank damage, discontinued models, and handle condition. |
| Reels | 48% to 66% | Each reel by size and series | Bearings, bail or levelwind wear, salt corrosion, and service records. |
| Lures and flies | 60% to 82% | Usable pieces or tray count | Hook rust, paint wear, collector demand, duplicate patterns, and missing skirts. |
| Terminal tackle | 50% to 76% | Boxes or sorted compartments | Rust, mixed sizes, opened packs, lead or tungsten mix, and label clarity. |
| Line and leaders | 35% to 62% | Spools and leader coils | UV age, partial spools, salt exposure, and unknown pound-test labels. |
| Electronics | 38% to 62% | Unit, transducer, mount, power cable | Screen age, updates, maps, battery health, connectors, and bracket completeness. |
| Bags and boxes | 42% to 68% | Bag, box, tray, crate | Zippers, latches, water intrusion, sun fade, and whether trays are included. |
| Tools and accessories | 45% to 70% | Each major tool or grouped smalls | Cutting edge, rust, batteries, scales, pliers, grips, and safety gear age. |
🧾Audit quality table
| Documentation level | What is counted | Calculator effect | Best next audit action |
|---|---|---|---|
| Photo only | Wide photos of boxes, rods, reels, and electronics | Small readiness boost | Add closeups of reel model plates and rod labels. |
| Item list | Category counts, model names, and average replacement values | Moderate readiness boost | Split high-value items from bulk terminal tackle. |
| Receipts | Order history, dated invoices, and serial numbers | Large readiness boost | Store copies outside the boat, garage, or tackle room. |
| Fresh inspection | Current condition notes with dates after cleaning | Reduces condition uncertainty | Retake photos after major upgrades or seasonal reorganizing. |
The calculator estimates planning value only. Actual resale, estate, or claim outcomes depend on local market demand, policy language, proof of ownership, and condition verification.
💡Inventory calculation notes
Separate high-value items. Rods, reels, electronics, and premium tools should be counted individually because model, age, and condition move value more than bulk quantity.
Use usable counts for small tackle. For lures, flies, hooks, and weights, count fishable items or organized boxes instead of every damaged or unlabelled piece.
Fishing gear are a collection of items that often sit in various location. A person may find the need to calculate the value of your fishing gear when they are moving, selling, or discussing insurance on there fishing gear. The value of the fishing gear may be less than the purchase price of the fishing gear.
The difference between the two value may be significant. The value of fishing gear may decrease if a person stores the fishing gear in a garage or a boat locker. The value of different type of fishing gear may decrease at different rates.
How to Find the Value of Your Fishing Gear
For instance, fishing rod may show wear on the guide or threads. Reels may have salt damage that isnt seen without service. Lures may wear down or a person may have an excess numbers of duplicate lures.
Electronics may lose value more quick because the software can become outdated. The condition of fishing gear may impact the value of the gear. People may not give it enough consideration when appraising the value of their fishing gear.
Fishing gear in an excellent condition will retain more of its original value than gear in good condition. Fishing gear stored in a climate controlled location will suffer less damage than gear stored in a location where the humidity and temperature may change. Gear exposed to salt corrodes more quick than gear that is used in freshwater.
A tool can be use to set these variable to calculate the value of the gear according to where it was stored. A persons documentation of fishing gear can impact the readiness of the gear for sale or insurance. Taking a photo of all of the fishing gear can increase the readiness score for the gear.
Adding documentation of the purchase price and model number can increase the readiness score even more. Documentation prevents people from having to use much of their interpretation of the value of fishing gear when understanding the value that a person place on the gear. Although documentation does not change the value of the fishing gear, it make it easier to convey that value to others.
The age of fishing gear and the frequency of its use can impact the value of fishing gear. A fishing setup that is three year old and used forty times per year will wear down more than a fishing setup that is three years old but used eight times per year. Each category of fishing gear wear down at a different rate.
Thus, gear that is use frequently will lose its value more quickly than gear that is used less often. The replacement value of fishing gear are not the same as the current value of that gear. The replacement value is the cost of purchasing new fishing gear that is similar to the gear that a person own.
The difference between the current value of the gear and the replacement value is the coverage gap. If a person is getting insurance for their fishing gear, they should understand this coverage gap. The deductible for the gear impact the coverage gap in relation to the value of the gear.
The reference tables included on this site can help a person determine whether the values that they enter into the replacement value calculator are within the normal range for the type of fishing gear that they own. The reference tables include the typical value of each category of fishing gear after three years. Additionally, the table reveal the factor that can impact the value of fishing gear.
The tables also convey what level of documentation indicate about the readiness of the gear. As time passes, fishing gear collection often grow. A person may not notice that the value of their fishing gear is decrease.
Periodic use of the value calculator will allow a person to recognize the value of their fishing gear. Using the calculator make it easier for a person to understand the value of their fishing gear and to make update to that value when their fishing gear change.