Angler Hours Per Acre Calculator
Estimate fishing pressure from lake area, angler trips, trip length, access coverage, catch rate, harvest share, and use pattern.
📌Effort scenario presets
⚙Effort inputs
Angler effort results
Calculation breakdown
📊Current estimate snapshot
Calculate to classify effort density.
Expanded for uncovered access.
Based on catch rate and retained share.
Uses the selected estimate confidence.
⚖Comparison grid
Light use
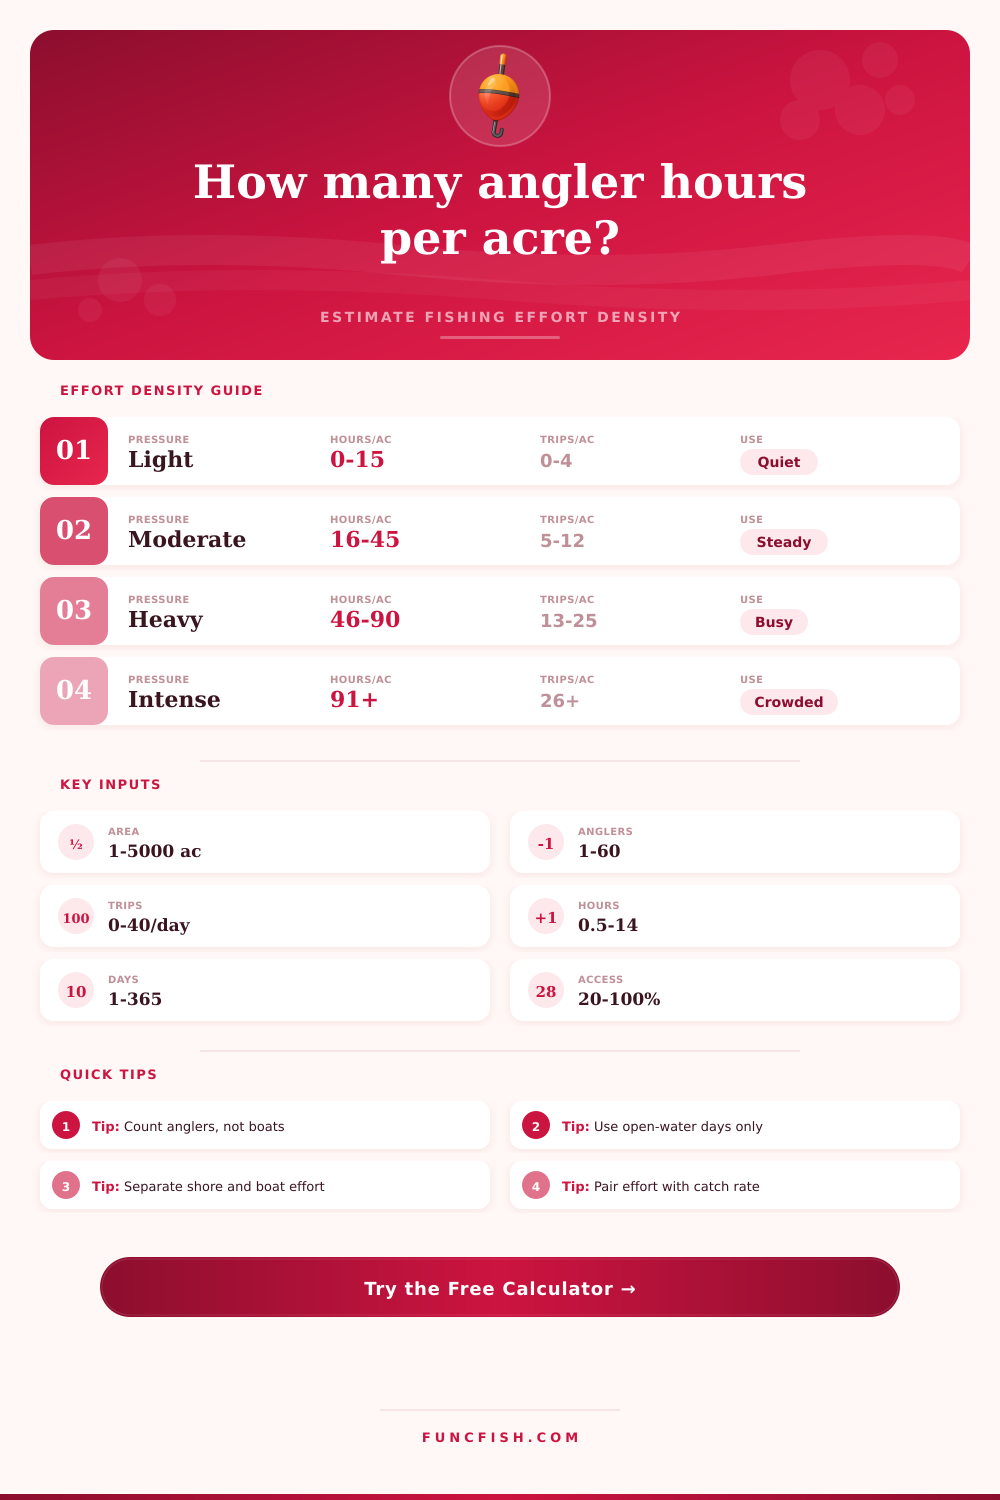
0 to 15 angler hours per acre; quiet pond, limited access, or short survey period.
Often low crowding and low catch contact per acre.
Moderate use
16 to 45 angler hours per acre; steady weekend use or regular club logs.
Good zone for comparing catch rate trends.
Heavy use
46 to 90 angler hours per acre; busy banks, compact water, or strong bite window.
Check whether effort is spread or concentrated.
Intense use
Over 90 angler hours per acre; small hot spot, event day, or urban access point.
Pair with harvest and release data before judging impact.
📘Reference tables
| Pressure class | Angler hours per acre | Trips per acre guide | What it usually means |
|---|---|---|---|
| Light | 0 to 15 | 0 to 4 | Occasional use, private access, small sample, or weather-limited days. |
| Moderate | 16 to 45 | 5 to 12 | Steady local use with enough hours to compare catch rates. |
| Heavy | 46 to 90 | 13 to 25 | Busy access, compact fishable area, or a strong bite window. |
| Intense | 91+ | 26+ | High contact pressure; separate hot spots from whole-lake effort. |
| Target group | Typical trip length | Useful catch-rate band | Effort note |
|---|---|---|---|
| Bass casting | 2.5 to 5.5 hours | 0.2 to 1.2 fish/hour | Often boat or kayak dominated, with effort spread across cover. |
| Panfish | 1.5 to 4 hours | 1.0 to 8.0 fish/hour | Short trips can still create high catch contact near banks. |
| Trout pond | 1.0 to 3.5 hours | 0.5 to 3.0 fish/hour | Use short-period calculations when effort arrives in bursts. |
| Catfish nights | 3.0 to 8.0 hours | 0.1 to 0.8 fish/hour | Night use is easy to undercount if access checks end early. |
| Walleye | 3.0 to 7.0 hours | 0.1 to 1.0 fish/hour | Boat counts need anglers per boat, not only launch count. |
| Ice panfish | 2.0 to 6.0 hours | 0.5 to 6.0 fish/hour | Pressure can concentrate sharply on small basins or weed edges. |
| Count method | Best use | Common bias | Suggested coverage input |
|---|---|---|---|
| Complete access count | Small ponds or one-gate lakes | Misses unofficial paths | 85 to 100 percent |
| Ramp expansion | Boat-heavy lakes | Underweights shore anglers | 70 to 95 percent |
| Roving creel | Large or mixed access water | Timing and route bias | 60 to 90 percent |
| Angler diary | Clubs and managed ponds | Only records participating anglers | 50 to 90 percent |
| Access camera | Known access points | Cannot always count active anglers | 65 to 95 percent |
| Spot check | Early planning estimates | High day-to-day uncertainty | 40 to 75 percent |
| Metric | Formula | Interpretation | Watch item |
|---|---|---|---|
| Total angler hours | Trips x anglers x hours x days / coverage | Total expanded effort for the period. | Coverage below 100 percent raises the estimate. |
| Hours per acre | Total hours / fishable acres | Normalizes effort across pond or lake size. | Use fishable acres, not full property area. |
| Trips per acre | Trips x days x anglers / acres | Shows visit density independent of trip length. | Large groups can hide behind low trip counts. |
| Catch per acre | Total hours x catch rate / acres | Estimated fish contact pressure. | Catch rate changes by target and skill mix. |
| Harvest per acre | Catch per acre x retained share | Approximate removal pressure. | Retained share should come from actual reports when possible. |
💡Effort calculation tips
If you’ve fished public lakes long enough, you’ve learned this lesson the hard way. There is a certain tension about them that most people do not notice until they catch it in their net. It begins with the relationship between space and time. You’ve got a finite amount of water; you’ve got a growing number of humans simultaneously wanting to use that same water.
Plug in the size of your lake and the number of trips it gets each year into the calculator and it will do the math for you. No need to guess about whether you’re facing overcrowded conditions or sustainable pressure.
Understanding Fishing Pressure
But numbers aren’t the whole story. So what does it all mean? Access is different from effort, so you need to know that. The lake might be huge, so a busy ramp doesn’t necessarily equate to lots of folks on the water. Similarly, a little community pond could feel like it’s packed with people in just three boats, but there isn’t much fishable space. You need this perspective when considering whether fewer catches are a result of “bad luck” or too many hooks in the water.
By putting information from your observed trips into the tool, you’re making a raw measure (angler trips) into a consistent metric (anglers per trip). And therefore, you enable an honest comparison. The access coverage percent is one of the trickier inputs. That number includes fishermen who didn’t happen to be present when you counted. Maybe they launch off that other road and were hidden in those reeds on the bank. Or maybe you’re only observing them from parking lot.
If your observation was less than 100% then setting this input to 100% will always underestimate actual pressure. That’s why it shows the bias of various count methodologies in the reference table on the page. Unless you’ve done a full access count (and that’s rare) most users should of leaned on the safe side with their coverage estimate. That way their data will match what is really there as opposed to just what they can see.
Raw hours don’t always tell the story either, which is why catch rate becomes another element to consider. Maybe you’ve got low effort density on paper, but if everybody’s catching three fish an hour, it’s still have a large impact on the population biologically. And then there’s total contact pressure versus harvest share, especially in terms of longer term planning. That will help you sort out a sustainable recreational experience from one that’s actualy depleting the resource. The tool will let you adjust those variables to see how their retention rates affects the final estimated pressure per acre.
Most folks underappreciate how fishing effort clusters together. Anglers aren’t distributed as evenly as salt on a table; they cluster up around accessible banks, cover and structure. One hundred hours dispersed over fifty acres doesn’t equate to one hundred hours in five acres of primmo habitat. That’s where crowding factors come into play with the calculator. If you’re aware that some areas are getting much more heat than others, it will help refine your estimate.
At the end of the day, this isn’t so much a “policing” issue as it is one of capacity, of what your water body can support given current levels. So while you may not know exact numbers, it does give you an idea of actual fishing pressure at certain times such as peak weekends or opening days. In other words, good guesses based off honest assumptions are infinitely superior to correct numbers based upon faulty reasoning.
Lastly, keep in mind that every cast consumes a certain amount of time within a finite area. Knowing exactly how much time is being invested in each acre will help manage that equation because the fish definitely let you know when things start getting out of whack.