Fish Fecundity by Weight Calculator
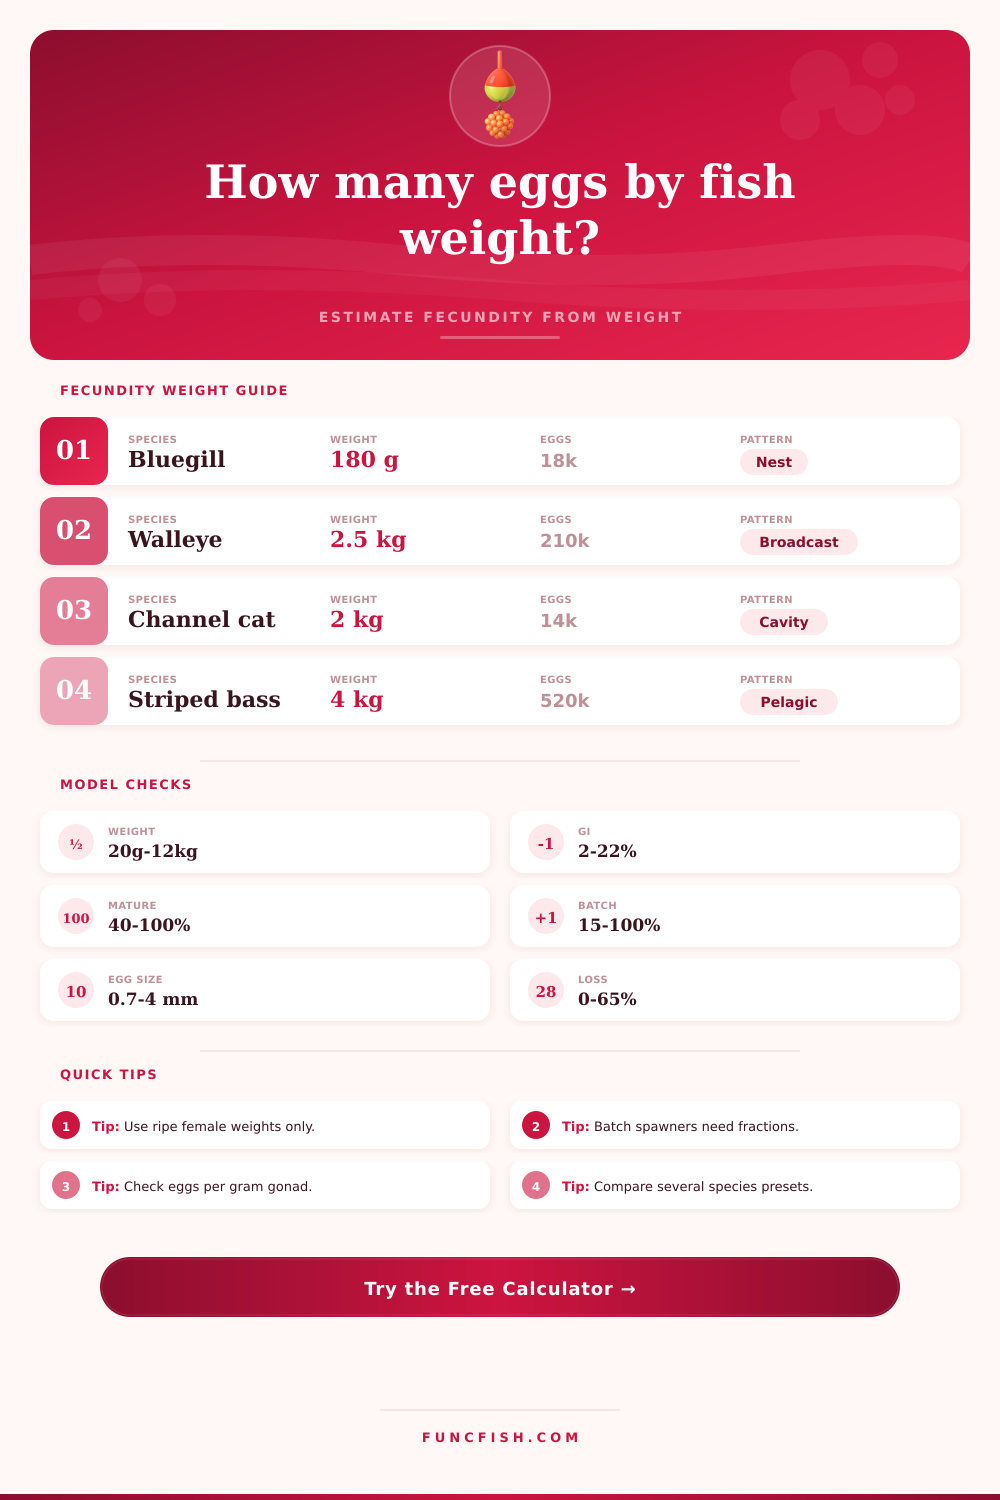
Estimate eggs per female, batch eggs, cohort egg output, eggs per kilogram, and viable eggs using species weight relationships, gonad index, maturity share, and expected loss.
1 Choose a fecundity preset
2 Enter fish and sample data
Fecundity estimate
Calculation breakdown
3 Quick output checks
Normalizes fecundity across body size.
From entered GSI and body weight.
Compares allometric eggs to egg density.
Based on the mean egg diameter field.
4 Species coefficients and reference ranges
| Coefficient set | Approx formula | Typical adult weight | Use when |
|---|---|---|---|
| Bluegill / sunfish | F = 315 x W^0.82 | 80 to 350 g | Pond nesting sunfish and compact centrarchids |
| Largemouth bass | F = 72 x W^1.12 | 0.5 to 4 kg | Centrarchid female with larger body size |
| Walleye | F = 54 x W^1.08 | 1 to 5 kg | Broadcast spawning percid estimate |
| Channel catfish | F = 18 x W^0.96 | 0.8 to 6 kg | Cavity spawning catfish with larger eggs |
| Nile tilapia | F = 9 x W^0.98 | 100 to 900 g | Mouthbrooder with low egg counts |
| Rainbow trout | F = 3.2 x W^1.03 | 0.4 to 5 kg | Salmonid egg count from female weight |
| Common carp | F = 220 x W^0.99 | 1 to 10 kg | High fecundity broadcast spawning cyprinid |
| Striped bass | F = 130 x W^1.06 | 2 to 12 kg | Large pelagic broadcast spawner |
| Egg diameter | Size class | Common examples | Interpretation |
|---|---|---|---|
| 0.6 to 1.1 mm | Small | Carp, striped bass, many pelagic eggs | Often high egg number and lower individual egg volume |
| 1.2 to 1.8 mm | Medium | Bluegill, crappie, bass | Balanced count for many warmwater nest builders |
| 1.9 to 2.8 mm | Large | Catfish, walleye variants | Lower count per gram, higher individual egg mass |
| 3.0 to 5.5 mm | Very large | Trout and salmonid eggs | Much lower eggs per gram gonad than small eggs |
| Input to adjust | Conservative setting | Aggressive setting | Why it matters |
|---|---|---|---|
| Maturity share | 60 to 75% | 90 to 100% | Immature or spent females should not contribute full eggs |
| Condition multiplier | 0.85 to 0.95 | 1.05 to 1.20 | Ripe, heavy females may exceed the baseline curve |
| Batch fraction | 15 to 35% | 75 to 100% | Batch spawners release only part of seasonal fecundity |
| Loss share | 35 to 65% | 5 to 20% | Changes the viable egg count after nonviable eggs |
| Egg density | 400 to 900 per g | 2000 to 6000 per g | Small eggs pack many more eggs per gonad gram |
| Comparison profile | Best output to watch | Expected pattern | Model caution |
|---|---|---|---|
| Small nest guarding species | Eggs per female | Moderate count, strong size response | Nests may contain eggs from multiple events |
| Broadcast pelagic spawner | Eggs per kilogram | High count, small eggs, large cohorts | Survival loss can dominate the final number |
| Large egg salmonid | Gonad density check | Low eggs per gram and large diameter | Weight curve may overstate small females |
| Batch or serial spawner | Batch eggs | Single event lower than annual total | Use batch count and fraction together |
5 Practical calculation tips
When you’re standing at the shore of a good walleye lake and you look around, it makes sense to think big females is spawning the majority of fish since they’re the biggest. The truth is, that thought process isn’t always correct.
Reproduction doesn’t scale up directly with fish weight; rather, it conform to biological curve that is dependent on species, water temp and the nutritional health of female. Simply weighing a fish is insufficient to guess her reproductive potential. How much weight leads to viable offspring are the hard part. I can say that a 20 inch largemouth looks like a nice fat fish but if she’s skinny or hasn’t quite reached maturity yet she might not produce as many egg.
Why Big Fish Don’t Always Mean More Babies
There is connection between body size and how many offspring can be produced. What that means is you don’t need to memorize the exponent for each species’ relative size and reproduction. That math has been done and include in calculator with just entry of your sample weights. It comes from decades of information about what kind of gonad tissue a fish supports at various life stages.
Think about it this way: There is a big difference between broadcast spawners such as striped bass and nest-guarding fish such as bluegill,” he said. “Striped bass throw out hundreds of thousands of tiny eggs that float downstream, hoping enough will make it to live. The male bluegill’s eggs are few in number but larger in size. He protects them, which improves their chances of survival but also requires more energy per egg.
The key is selecting the right preset in the tool, which ensures the model applies proper biological logic. If you select a bass coefficient with catfish, it won’t work because they employ different strategy. They bet on quality (protection) vs. Quantity.
Outside of species selection, condition factor are often overlooked. And weight isn’t indicative of body composition. For example, a three-pound fish you catch in early spring may have been metabolizing throughout the winter. It may thus be relatively lean compared to a two-pound fish you catch in late summer when she’s well fed up before spawning. Her gonadosomatic index would thus be lower then that of the two-pound fish. Condition multiplier makes up for this reality. It is another little thing but important for accurate results.
You also need to consider batch spawners, those that will release their eggs over multiple weeks instead of all at once. If you don’t account for this, you would of overestimated a single instance and underestimate total output for the season.
Density calcs also reflect size of egg. Because more yolk makes larvae stronger, larger eggs has a lower proportion of gonads by weight. This change affects density calculation. Look at table of references and you’ll notice that egg diameter reflects strategy in each species. Salmonids are much larger eggs with lots of nutrients so they have less per gram than say common carp. This is basic biology, not a mistake in the moddern model.
The densities helps prove the estimate and confirm that predictions stay within physical limits. No formula can replace local knowledge. Population history, water quality, and predator pressure all play a role in how many of those eggs become fish. The tool is a baseline estimate based off maturity and weight, but that number needs to be interpreted from your local environment.
Are the local trout skinny because the hatches have been bad? Unless you account for condition, the model will overstate their contribution. Use math as your base line but trust your eyes to put it in context. Observing helps you with both angling and managing. It turns data into understanding. The numbers give you a start, but what’s there tells you where they realy are.