Fish Body Depth Ratio Calculator
Estimate body depth as a percentage of fish length, compare the specimen with species benchmarks, and review shape class, fineness ratio, compression index, and condition notes.
📌Morphology presets
⚙Measurement inputs
Body depth results
Calculation breakdown
📊Morphology quick bands
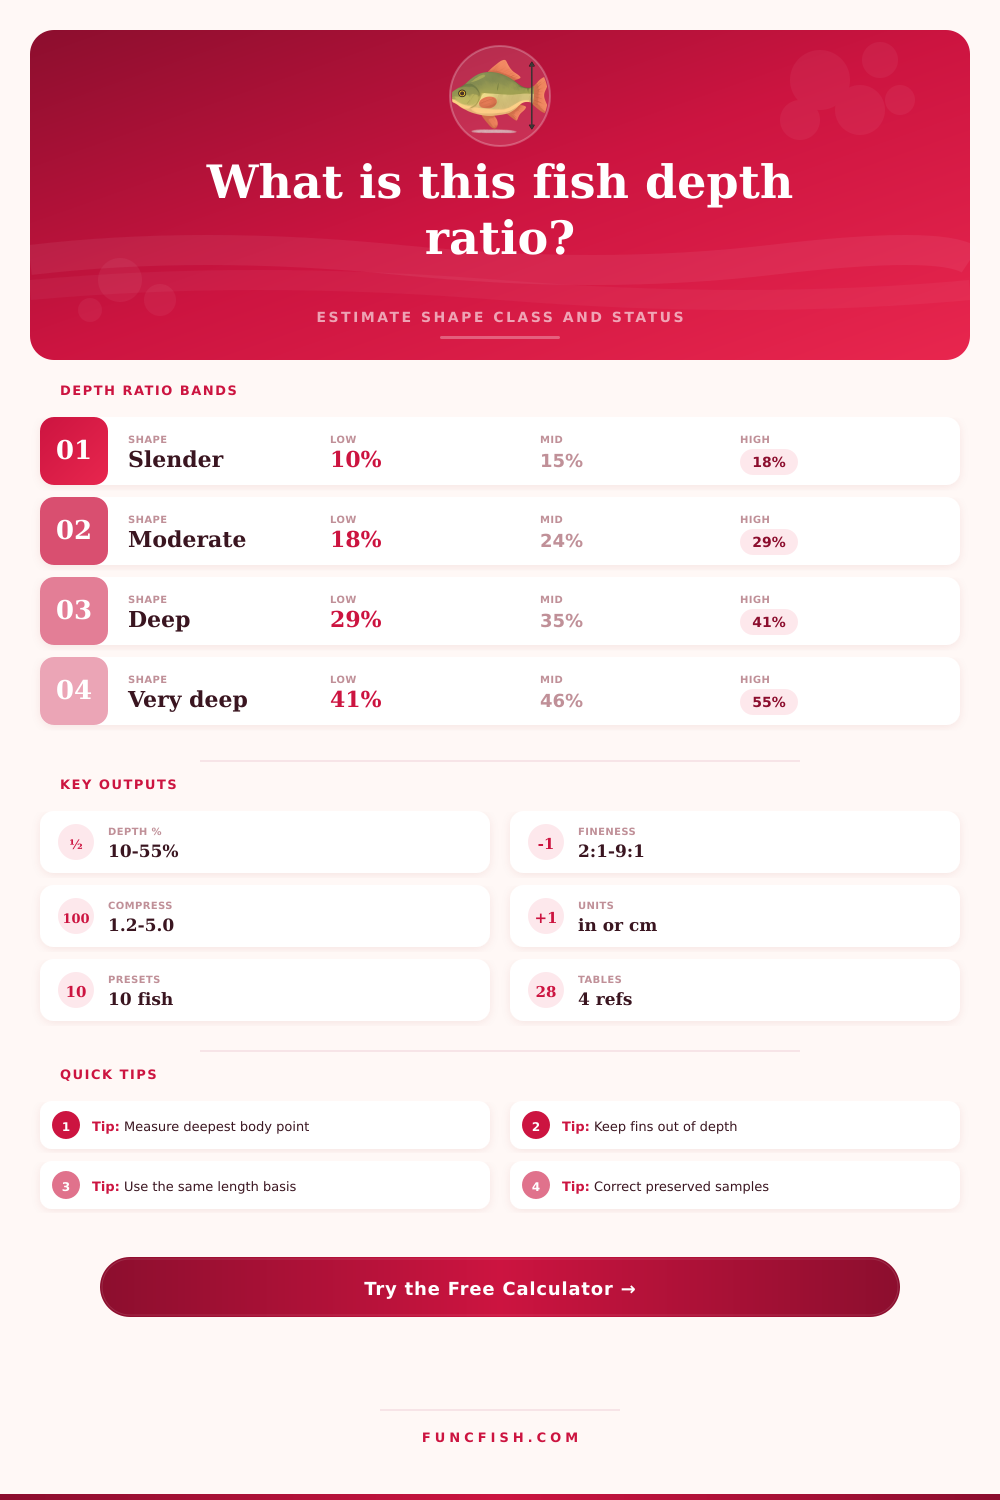
Typical of pike, smolts, and fast-water trout forms.
Common in bass, walleye, catfish, and many river fish.
Useful band for crappie, carp, tilapia, and stout adults.
Often seen in sunfish, bream, and strongly compressed forms.
📐Reference tables
| Species profile | Typical depth ratio | Common shape | Benchmark note |
|---|---|---|---|
| Largemouth bass | 24-32% of TL | Moderate-deep | Adult body depth often rises before spawning. |
| Rainbow trout | 16-23% of TL | Streamlined | Fast-water samples tend toward the lower end. |
| Bluegill | 38-48% of TL | Very deep | Compressed sunfish bodies can exceed 45%. |
| Black crappie | 33-41% of TL | Deep | High-backed adults are often called slab-shaped. |
| Channel catfish | 18-25% of TL | Moderate | Depth is usually taken ahead of the dorsal fin. |
| Northern pike | 12-18% of TL | Streamlined | Elongate predators produce low depth ratios. |
| Tilapia | 34-43% of TL | Deep | Culture-fed fish may be deeper than wild fish. |
| Common carp | 28-38% of TL | Deep | Body depth varies strongly with strain and condition. |
| Length basis | Where it ends | Best use | Calculator treatment |
|---|---|---|---|
| Total length | Tail tip | Angling and general field notes | Uses measured TL or estimates TL from other lengths. |
| Fork length | Tail fork | Forked-tail sport and marine fish | Uses species fork-to-total factor if missing. |
| Standard length | Tail base | Biology, taxonomy, lab records | Uses species standard-to-total factor if missing. |
| Photo scale | Chosen landmark | Image-based estimates | Adds uncertainty but keeps the same formula. |
| Shape band | Depth ratio | Fineness ratio | Interpretation |
|---|---|---|---|
| Slender | Below 18% | Above 5.6:1 | Long body relative to depth; strong length signal. |
| Moderate | 18-29% | 3.4:1 to 5.6:1 | Balanced body depth for many predators and river fish. |
| Deep | 29-41% | 2.4:1 to 3.4:1 | High back, stout profile, or strong adult condition. |
| Very deep | Above 41% | Below 2.4:1 | Laterally deep or highly compressed body form. |
| Measurement issue | Likely effect | Correction choice | Field note |
|---|---|---|---|
| Fins included in depth | Ratio too high | Re-measure body only | Compress dorsal and anal fins out of the reading. |
| Fish curved on board | Length too short | Use ruler or caliper quality | Straighten gently before measuring total length. |
| Preserved sample | Length and depth shrink | Select formalin or ethanol | The calculator applies small live-equivalent corrections. |
| Photo perspective | Width/depth distorted | Select photo condition | Use only side-on images with a visible scale. |
🔍Comparison grid
Low depth percentage; compare with pike, smolt, and river trout forms.
Relative depth close to the selected species target after corrections.
Depth is at least three times body width, common in high-backed fish.
Quality score suited for comparing samples across days or stations.
💡Calculation tips
Tip: Keep every sample on the same length basis. A 35% standard-length depth ratio is not directly equal to a 35% total-length depth ratio.
Tip: For photos, choose images where the fish is flat to the camera. A tilted fish can inflate body depth and deflate body width at the same time.
A new largemouth bass is in your grasp and you’re standing over a measuring board with a ruler in your hand; you look at this great fish and wonder if it’s merely decent or destined for the record books. The obvious answer is that it’s partly about the length, but the body depth typically reveals the real deal. An adult will be thick and slab sided; that thickness conveys weight more differently than a long, stringy juvenile can manage.
This calculator compare fish length to body depth. It then reports benchmark status, compression, and morphology class to keep lab, field, or photo-based sample records consistent. In other words, it takes raw numbers and transforms them into biological context; exactly what you need when those numbers on their own is ambiguous.
How to Measure Fish Correctly
The metric itself is simple enough. It’s just the maximum vertical height of fish divided by total length. By using a calculator like the one above, you can enter your dimensions without having to do the math in your head to avoid getting a wrong number. What makes this valuable is knowing where you’re measuring the length to. Whether you define it as the base of the caudal fin or all the way to the tip of the tail affect the denominator and thus the percentage. It is a tiny detail that makes a huge difference when trying to be accurate.
The site defaults to what most serious anglers and field biologists use: total length. But taxonomists tend to favor standard length (ending at the base of the tail) because the tail fins may becomes worn or otherwise damaged. You can toggle between them without having to restart. And you can account for how specimens are preserved, because alcohol (ethanol) can change dimensions one way while formalin makes tissues shrink another. A preserved fish in a museum could appear quite thin relative to its live form; that’s why they say “fish shrink when they die.” That’s what folks do wrong. They match recent catches against archived data without factoring in chemical shrinkage.
The ratio is just the beginning, though. From that input, you get a bunch of other information, like a compression score and a fineness index. Length divided by depth are your fineness ratio. That will show you how streamlined it’s going to be. A higher number means a torpedo shape that is best for distance and steady speed. A lower number reflects more of a deep, blunt body built for quick bursts of acceleration but not as well for long runs. Then there’s compression, which basically tells you if the fish is tall and skinny or flat and wider. Catfish are flatter and wider, while sunfish is taller and thinner. This will help you understand why two fish of equal depth may have different amounts of muscle mass. It also explains why they may react differently to current.
But it’s also important to understand what might appear “normal” vs unusual depending on context. Obviously a skinny, long young trout from a swift flowing mountain stream would be different than a fat, deep trophy trout from a nutrient-rich slow lake. Genetics shape them but so does their environment. Drag of current rewards a more streamlined form. Still water with a lot of food lets them grow heavier and deeper. That’s why the tool lets you set conditions and life stage. It then benchmarks your fish relative to others under similar environmental conditions. So you’re not using lake standards to judge your river trout.
The other invisible variable that pollutes more data than poor mathematics is measurement quality. How do you measure length without also curving the fish on the board? This shortens the length read and skews the depth ratio upward, making the depth seem greater. How do you include the dorsal fin in your height read without doing the same? You don’t; you want pure body contour, no fin structure! The calculator includes quality flags to remind you of those potholes. This nudges you toward caliper precision instead of hasty tape measure methods when accuracy matters.
It all boils down to consistency. You don’t need perfect measurements, but you do need honest ones if you want to find trends. When you know the baseline on your home waters, it becomes a useful language to measure maturity and health in your fishery. That’s where the tool comes in and translates the language into plain English. Does that big ole bass you caught mean he’s an outlier? Or does it simply indicate healthy habitat doing its job? You began with a guess and a ruler. Now you’ve got a picture, a benchmark, and a profile underneath the scales.