Fish Nest Density Calculator
Convert nest survey counts into corrected spawning bed density with visibility, duplicate overlap, active nest share, habitat quality, and species spacing accounted for.
📌Survey presets
⚙Nest survey settings
Nest density estimate
Formula breakdown
📋Survey correction grid
Visibility
Overlap
Active share
Spacing
📊Density reference tables
| Species group | Low density | Moderate density | Dense bed field | Typical spacing |
|---|---|---|---|---|
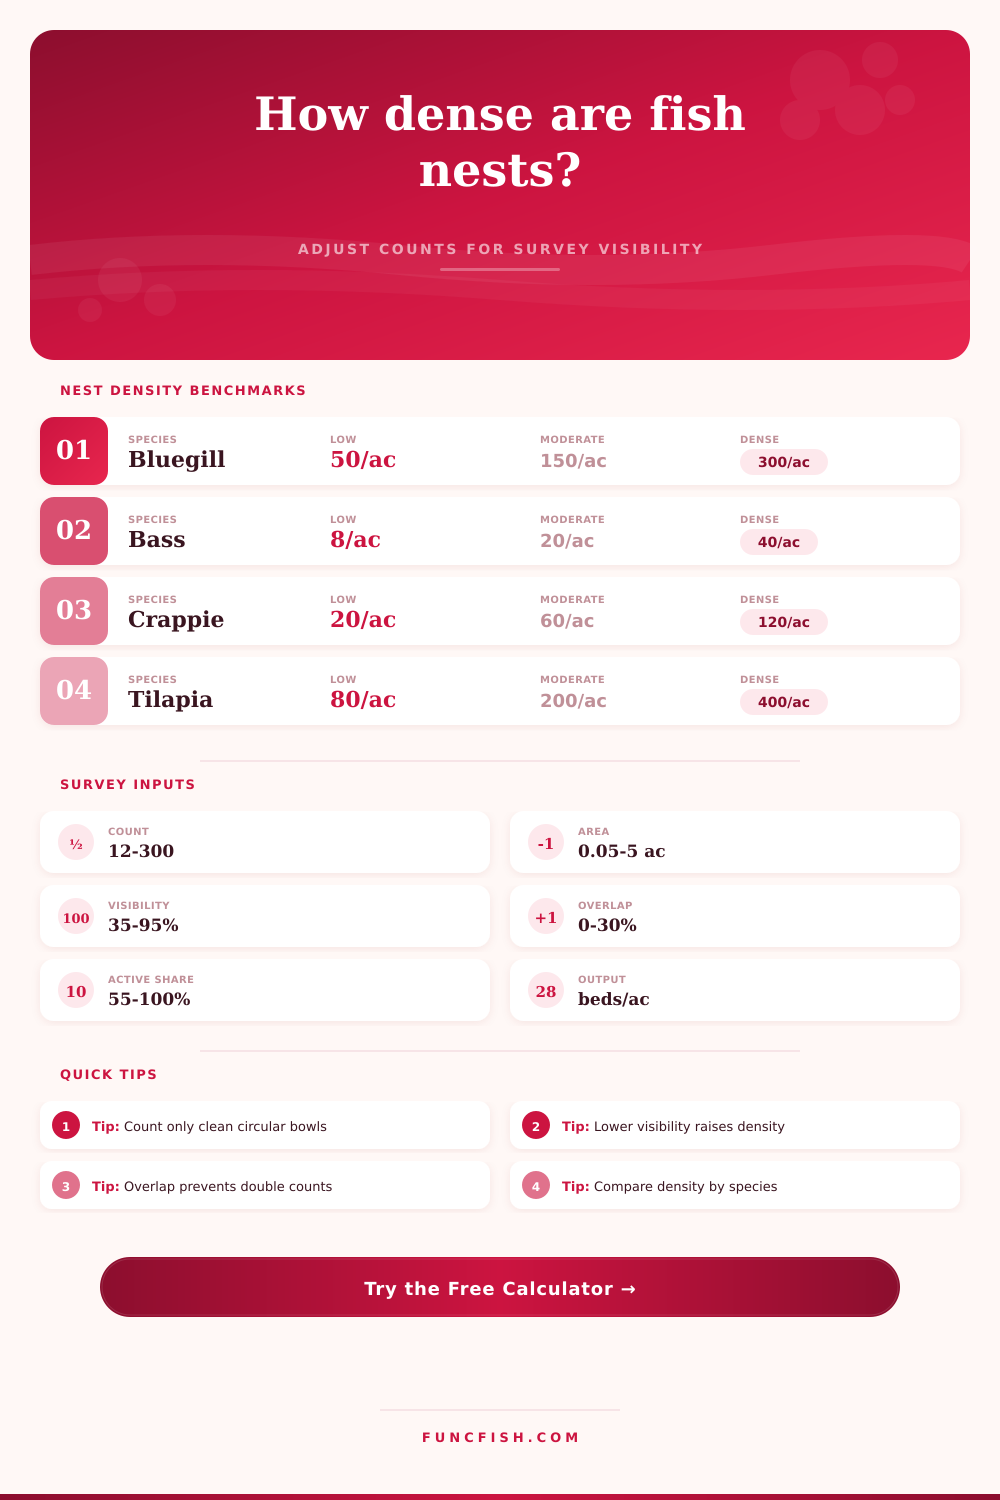
| Bluegill / colony sunfish | Below 50 nests/ac | 50-180 nests/ac | 180+ nests/ac | 3-8 ft |
| Largemouth bass | Below 8 nests/ac | 8-24 nests/ac | 24+ nests/ac | 20-45 ft |
| Smallmouth bass | Below 6 nests/ac | 6-18 nests/ac | 18+ nests/ac | 18-40 ft |
| Crappie | Below 20 nests/ac | 20-70 nests/ac | 70+ nests/ac | 8-18 ft |
| Tilapia | Below 80 nests/ac | 80-240 nests/ac | 240+ nests/ac | 2-6 ft |
| Catfish cavity nest | Below 4 nests/ac | 4-14 nests/ac | 14+ nests/ac | 25-70 ft |
| Walleye shoal cluster | Below 10 nests/ac | 10-35 nests/ac | 35+ nests/ac | 10-30 ft |
| Rock bass / pocket sunfish | Below 15 nests/ac | 15-55 nests/ac | 55+ nests/ac | 6-16 ft |
| Survey method | Best water | Base reliability | Common bias | Density use |
|---|---|---|---|---|
| Snorkel line count | Clear to stained | 0.92 | Misses deep beds | High-detail colonies |
| Boat visual transect | Shallow clear coves | 0.78 | Glare and angle | Fast shoreline checks |
| Overhead drone pass | Clear, low glare | 0.84 | Can merge nests | Large flats |
| Wade-and-map survey | Firm shallow flats | 0.88 | Disturbs soft bowls | Precise bed outlines |
| Drop camera grid | Deep or stained | 0.74 | Small view window | Spot verification |
| Side-scan sonar review | Open bottom | 0.68 | False circles | Broad reconnaissance |
| Habitat quality | Substrate cue | Confidence factor | Expected pattern | Field note |
|---|---|---|---|---|
| Patchy or silty | Soft edge bowls | 0.72 | Scattered nests | Confirm active fish |
| Fair mixed bottom | Sand with debris | 0.86 | Loose groups | Map boundaries carefully |
| Good sand / gravel | Clean circular bowls | 0.96 | Consistent spacing | Best for transects |
| Excellent clean bowl substrate | Firm bright substrate | 1.00 | Strong colony signal | Use smaller grid cells |
| Density class | Corrected density | Spacing cue | Interpretation | Review trigger |
|---|---|---|---|---|
| Low | Below species low band | Wide gaps | Limited nesting activity | Check timing |
| Moderate | Within species band | Stable spacing | Typical spawning use | Compare coves |
| Dense | Above dense band | Tight groups | Strong bed concentration | Check double counts |
| Crowded | Far above dense band | Very tight bowls | Potential colony overlap | Resurvey sample cells |
🧭Species comparison grid
| Species | Nest style | Best survey window | Count risk | Density caution |
|---|---|---|---|---|
| Bluegill | Colonial saucers | Bright shallow flats | Overlapping bowls | Separate fresh rims |
| Largemouth bass | Solitary guarded beds | Protected coves | Glare misses | Use lower density bands |
| Smallmouth bass | Gravel pocket nests | Clear rocky runs | Depth loss | Adjust visibility hard |
| Crappie | Loose cover clusters | Brush and edge flats | Cover shadows | Verify with multiple passes |
| Tilapia | Tight crater fields | Warm pond margins | Merged craters | Use overlap correction |
| Catfish | Cavity or box nests | Structure checks | Hidden entrances | Report lower confidence |
💡Practical checks
Tip: Use effective visibility as the percent of real nests you believe the survey could detect, not the water clarity reading alone.
Tip: In colony nesters, raise duplicate overlap when rims touch or when drone images blur neighboring bowls into one patch.
When you spot bluegill nests from boat, it looks like one bowl. But then, upon close inspection, you might realize you’re just seeing three overlapping bowls instead of one. No wonder raw nest counts is so inaccurate. What you see is distorted by water clarity, the angle of your survey and species behavior.
Once you input what you saw in the field, the calculator do the math for you, and you don’t need to guess whether murky coves are empty or hiding a large colony. It converts your visual data into a corrected density estimate that accounts for conditions on bottom.
How the Nest Counting Tool Works
The main variables is visibility, detection rates change based off how much light penetrates the water. If you’re snorkeling and water is clear, you’ll see ninety percent of the nests. After a rainfall, however, you’ll see about forty percent due to stained water. To make up for this, the tool divide the count by the percent visibility, essentially inflating the count to make up for nest that were missed. It is a pretty simple correction, but it avoids overcorrecting and coming away with an idea that lake isn’t as busy as it really is (even though you couldn’t see them).
Another mistake, also causing inflated counts (is duplicate overlap). If you don’t correct for this, you’ll inflate your number too. In thick sunfish colonies, nest rims often gets close to one another. They can even merge when viewed from a high vantage point, such as a high angle or a drone photo. Counting each round depression will probably cause you to double count the shared rim boundaries. The overlap input allow you to enter a percent value to account for merged signal overlap. This doesn’t have to be perfect, but realizing that there are visually connected nests keeps you from painting an unreealistic picture of super-dense bedding.
Active share filters out old or abandoned nests. Spawning is a dynamic process and a flat might contain dozens of bowl shapes from various years or even days. For current stock assessment, only the fresh nest matter. Enter an active share percentage to let the calculator know to focus only on nests that represent current reproductive effort. That’s the difference between present-day biology and historical debris.
That’s where the correction factor come in. The reference table puts that number into perspective by the species. A nest density of 100 per acre is standard for sunfish (they form tight colonies) but would of suggest an out-of-control explosion for bass. Knowing what to expect, based on similar numbers from your output, will help you calibrate your expectations. If you get a lower density reading with bass, it could be because you’re in poorer habitat; a good number for bluegill tells you they’ve had bad spawn.
The spacing estimates provides a clear image of what the underwater environment looks like. If it’s a wide number, you’re seeing solitary sentries that will defend vast stretches of territory. A tight estimate mean they’re behaving as a colony and sharing workload. Knowing this tells you where to toss your bait. Wide spacing typically goes with greater activity and more hookups, whereas a tight estimate suggest you should cover more water to locate the handful of active males.
Everything is anchored to reality through habitat quality inputs. If a person surveyed and had the best technique, but the substrate was too silty and fish couldn’t dig good bowls, then the fish would be missed. The tool accounts for whether the bottom is clean gravel or patchy muck, so confidence levels adjusts to match. It’s not just about counting, it’s about verifying that what you just counted has the environment to support it.
I compare it more to pattern recognition than absolute accuracy in your estimate of nest numbers. By taking the guess work out of both visualizing and correcting for overlaps, you can then interpret what the numbers tells you about the fishery. Combining corrected estimates with species specific standards allows you to go beyond guessing and know exactly where the fish will be holding. This change from observing to understanding transforms an informal survey into useful biological information. What used to be ripples now tells you how lake reproduces.