Fish Weight Gain Per Season Calculator
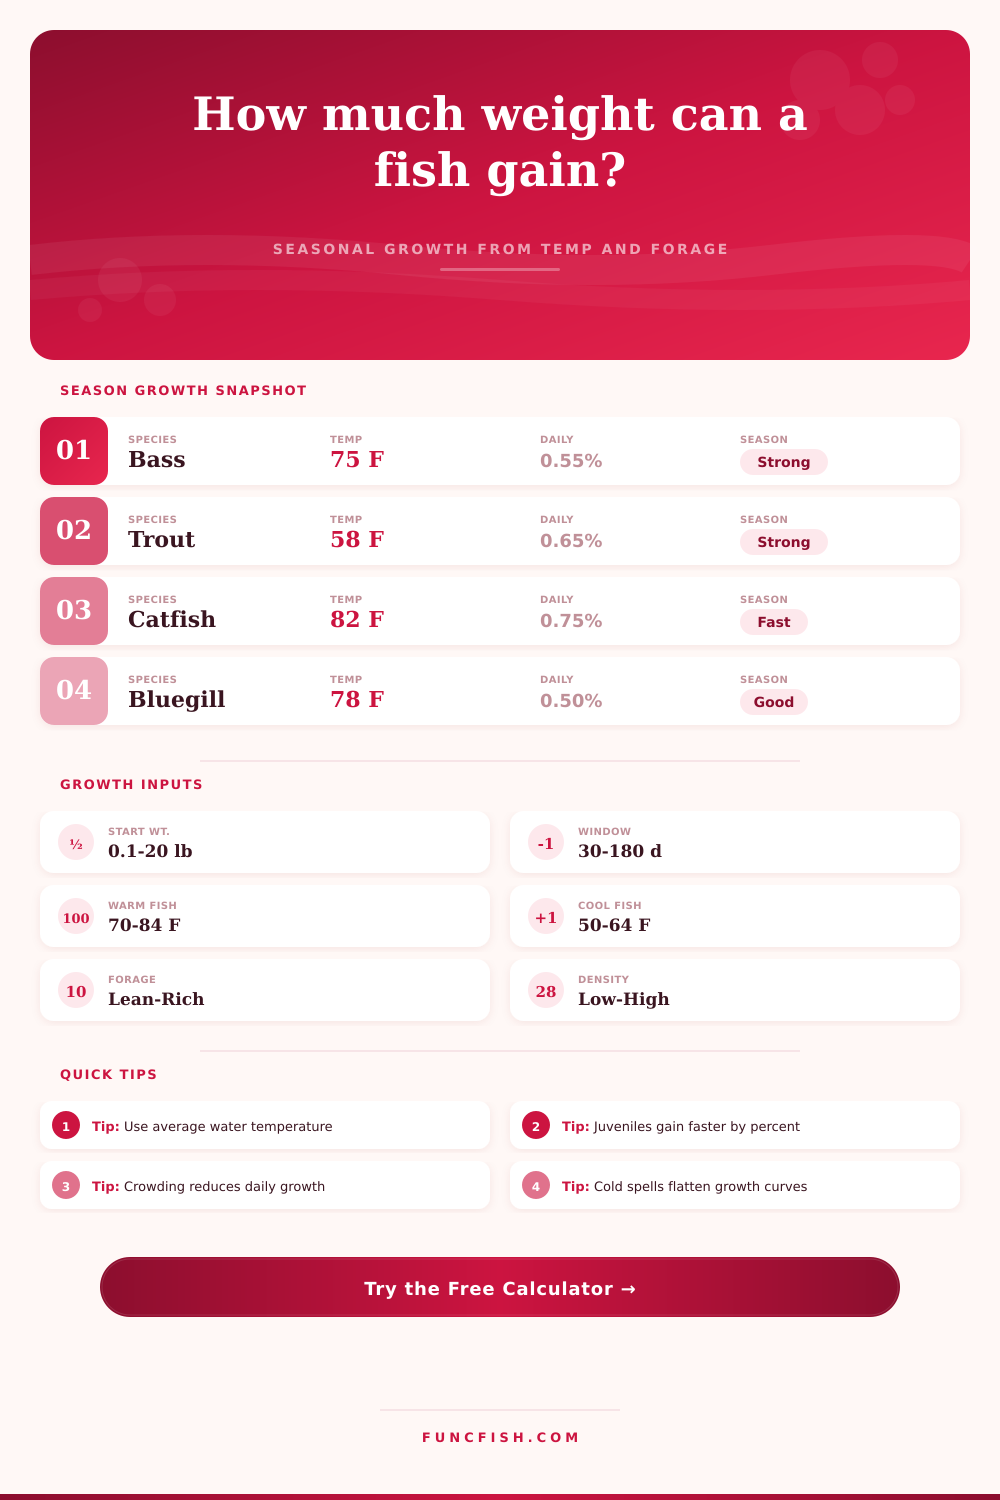
Estimate seasonal fish weight gain from species, starting weight, life stage, water temperature, forage level, and competition pressure.
📌Growth scenario presets
⚙Season growth inputs
Seasonal weight gain estimate
Formula breakdown
📋Species comparison grid
Largemouth bass
Bluegill
Channel catfish
Rainbow trout
Tilapia
Walleye
Yellow perch
Common carp
📑Reference tables
| Species group | Ideal water temp | Baseline daily growth | Temperature tolerance |
|---|---|---|---|
| Largemouth bass | 76-82°F / 24-28°C | 0.55% body weight/day | Warmwater, slows below 60°F |
| Smallmouth bass | 68-74°F / 20-23°C | 0.46% body weight/day | Mild warmwater, less heat tolerant |
| Bluegill | 76-82°F / 24-28°C | 0.50% body weight/day | Warmwater, forage-driven |
| Channel catfish | 80-86°F / 27-30°C | 0.75% body weight/day | Strong warmwater response |
| Rainbow trout | 54-62°F / 12-17°C | 0.65% body weight/day | Coolwater, heat sensitive |
| Tilapia | 82-88°F / 28-31°C | 0.95% body weight/day | Fast growth in warm water |
| Walleye | 64-70°F / 18-21°C | 0.38% body weight/day | Cool to mild warmwater |
| Yellow perch | 66-72°F / 19-22°C | 0.42% body weight/day | Cool to mild warmwater |
| Growth modifier | Low value | Middle value | High value |
|---|---|---|---|
| Forage or feed availability | Scarce: x0.45 | Adequate: x1.00 | Supplemental: x1.28 |
| Population competition | Low: x1.08 | Balanced: x1.00 | Crowded: x0.52 |
| Life stage | Trophy: x0.35 | Subadult: x0.82 | Fingerling: x1.55 |
| Seasonal activity | Winter: x0.22 | Spring: x0.94 | Controlled: x1.08 |
| Water temperature position | Growth factor | Common result | Calculator behavior |
|---|---|---|---|
| At ideal range | 0.90-1.00 | Best conversion to weight | Applies nearly full species daily rate |
| 5°F from ideal | 0.70-0.85 | Good but slower growth | Reduces compound daily percentage |
| 10°F from ideal | 0.42-0.65 | Growth becomes uneven | Shows lower efficiency score |
| 15°F+ from ideal | 0.18-0.40 | Maintenance dominates | Caps growth to a low active rate |
| Example scenario | Starting fish | Strong season gain | Constrained season gain |
|---|---|---|---|
| Juvenile bass, forage rich | 0.75 lb / 0.34 kg | 0.45-0.75 lb | 0.12-0.25 lb |
| Adult bluegill, balanced pond | 0.35 lb / 0.16 kg | 0.08-0.16 lb | 0.02-0.05 lb |
| Fed catfish, warm water | 1.00 lb / 0.45 kg | 0.85-1.45 lb | 0.25-0.55 lb |
| Trout, cool oxygenated water | 0.50 lb / 0.23 kg | 0.28-0.55 lb | 0.05-0.16 lb |
| Large adult bass, crowded | 4.00 lb / 1.81 kg | 0.35-0.80 lb | 0.03-0.20 lb |
💡Growth estimate checks
Tip: Average water temperature matters more than one warm afternoon reading. If the season swings hard, run the calculator once for each month and add the gains.
Tip: A high forage setting assumes fish can actually reach and consume that forage. Dense cover, size mismatch, and crowded populations can still lower gain.
On a sunny afternoon, the water temperature will only tell you so much. It won’t tell you what is going on with fish below the surface. And that is the fundamental trap of pond management.
So you pull out your surface thermometer and it reads eighty degrees? Well then the bass must be feeding like madmen, right? Wrong. The reality is there may be poor oxygen levels or they’re living in stratified layers that has essentially shut down growth in the deeper channels.
The Hidden Factors Behind Fish Growth
Looking beyond the snapshot is vital when understanding how to increase seasonal weight gain. Daily conditions compound themselves over a period of ninety days.
The starting weight is a factor most anglers concentrate on, but as you will see from the calculator above, when you enter your variables it do all the math for you. That way you don’t have to guess at how various factors compare with one another.
What drives this are the baseline daily growth percentages, which again widely vary among species. In optimal temperatures, tilapia can grows close to 1% of its body weight daily. Even in their optimum temp range, walleye might only manage forty percent of that tilapia growth rate.
And no, I’m not talking about feeding habits; I am talking about metabolic efficiency. Because fish are cold-blooded creatures, they run on water temps like an internal furnace. Too warm and stress hormones increases. Too cool and digestion becomes slow and what comes in doesn’t get converted into mass.
They’re all accounted for with a set of factors that match real world limits. One of the more neglected variables is forage availability. Rich forage base doesn’t necessarily mean there’s lots of food; it means how good the food is and how accessible it is.
It’s possible to have a lot of bluegill in a pond, yet the bass might be too small to catch them and growth rate suffers. That’s why life stage input comes into play. Since fingerlings need more energy for their size and have less weight to gain, they grows at a faster rate then trophy-sized adults.
Even under the exact same water conditions, a four-ounce juvenile won’t ever gain weight as quickly as a two-pound bass. The second part of the equation shifts with competition.
When the pond is crowded, it’s no longer about turning calories into body mass. Instead, it’s about chasing whatever little bit of resource is available and maintaining those school dynamics. Nature doesn’t serve up free lunches so the calculator applies a reduction factor for high density.
When food is hard to come by, survival isn’t always about who ate the most but who burned the least calories. That means you have a stunted population in which the average weight will still be small even after years of fishing pressure.
Another level of complication comes from seasonal timing. The warming trend in spring gets them moving again after a winter lull and they feed like crazy. But then, peak summer heat can also cause thermal stress that limits their growth potential, even with plenty of food available.
So the calculator has a seasonal activity factor that compensates for these biological rhythms. That means the same fish in mid May isn’t going to act the same way as the same fish in mid August.
This helps you understand how well your particular setup lines up with what this species needs biologically by generating an efficiency score. A low score means that things like your forage levels or temperatures is preventing the fish from growing at their best.
The presets allow you to get an idea of what various scenarios would look like, from a warmwater catfish pond to a coolwater trout stream. The reference tables on the page break it down and shows you the optimal temperature bands for each species.
For example, trout do well in cooler temperatures where there is more oxygen. In these conditions, they can maintains their metabolism efficienty without dealing with the heat stress that hinders bass.
Conversely, bass are made for warm water but don’t do so well once the water starts getting to warm or the oxygen begins dropping. It all boils down to this: Growing fish requires balance.
No matter what you do, no one can make a species grow beyond what its physiology will allow. But if we create an environment that helps it get as large as possible while accounting for temperature thresholds, density, forage, etc., then we’ve got ourselves a good system out of what could of been a dead pond.
Numbers are merely a starting place. From there, it’s up to the water.