Fish Body Fat Percentage Estimator
Estimate field body fat percentage from species profile, length, weight, girth, season timing, forage condition, and reproductive stage.
📌Condition presets
⚙Body condition inputs
Estimated fish body fat results
Formula breakdown
🐟Species comparison grid
Largemouth bass
Rainbow trout
Channel catfish
Chinook salmon
Walleye
Bluegill
Common carp
Northern pike
📊Reference tables
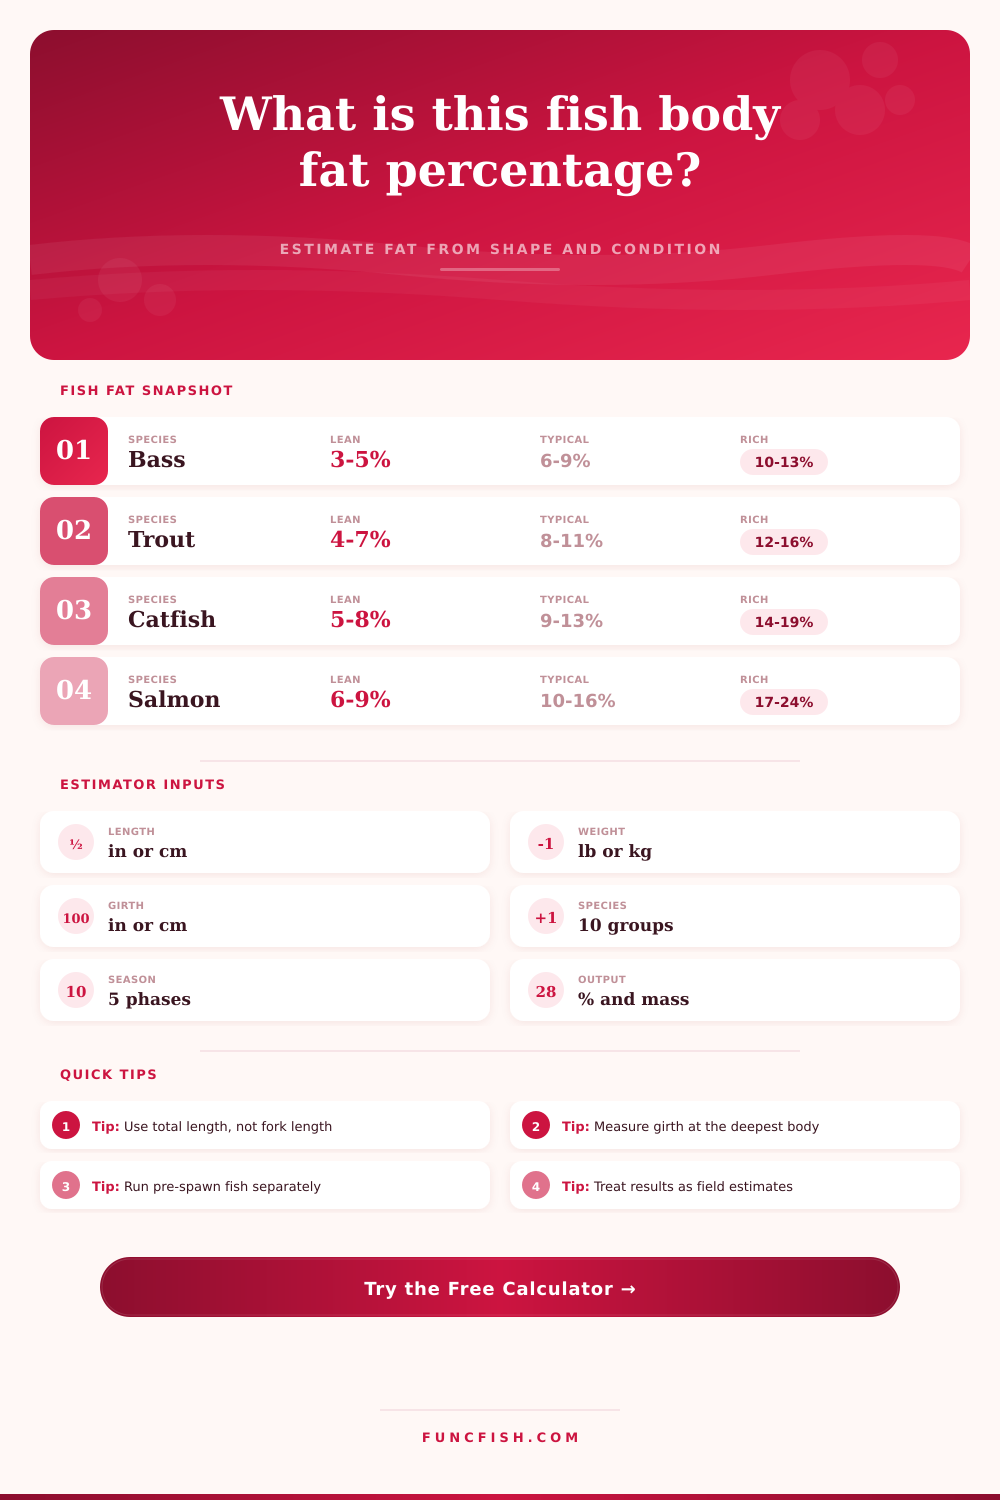
| Species group | Lean field fat | Typical reserve | Rich reserve |
|---|---|---|---|
| Bass, walleye, pike | 2-5% body weight | 5-9% body weight | 9-13% body weight |
| Trout and salmonids | 4-7% body weight | 8-15% body weight | 16-24% body weight |
| Catfish and carp | 5-8% body weight | 9-14% body weight | 15-19% body weight |
| Bluegill and panfish | 4-6% body weight | 7-11% body weight | 12-15% body weight |
| Shape measurement | Formula use | Low reading | High reading |
|---|---|---|---|
| Fulton condition factor K | Weight for length | Thin or recently spent | Heavy frame or stored energy |
| Girth-to-length ratio | Body depth and roundness | Compressed or lean body | Deep body, full belly, or roe |
| Weight and girth agreement | Confidence check | One measurement may be off | Estimate becomes more stable |
| Species lipid range | Caps the result | Prevents impossible low estimates | Prevents impossible high estimates |
| Season or stage | Typical fat signal | Calculator modifier | Interpretation note |
|---|---|---|---|
| Pre-spawn buildup | High mass and girth | Adds reserve, then adjusts roe | Some added mass is reproductive tissue |
| Post-spawn recovery | Low to moderate reserve | Subtracts from the estimate | Spent fish often look long and light |
| Summer feeding | Moderate reserve | Near neutral modifier | Warm water raises feeding and metabolism |
| Fall forage peak | Strong reserve | Adds positive modifier | Many predators store energy before winter |
| Reserve class | Body fat estimate | Common field look | Best use of result |
|---|---|---|---|
| Lean | Below species typical | Flat belly, low girth, sharp profile | Flag poor forage or recent spawning |
| Moderate | Middle species range | Balanced weight for length | Use as a normal condition baseline |
| Rich | Upper species range | Rounded belly and strong shoulders | Compare forage-rich or pre-winter fish |
| Very rich | Near the species cap | Heavy body with high girth | Check for roe-heavy or recently fed fish |
💡Estimator checks
Tip: This is a field estimator, not a lab lipid extraction. It is best for comparing fish from the same species, water, and season.
Tip: If girth is missing, measure it before trusting the result. Weight alone cannot separate stored fat from frame size, food, or roe.
Lift the bass out of the net and feel how light it feels. Yeah, the bass looks long enough. But its belly is flat. That’s because you’ve got an animal that spent more energy than it can store.
Enter this estimator. Anglers estimate condition by relying on weight. Weight are a poor indicator. It does tell you what kind of matter is in the fish, but it doesn’t tell you how much of that matter is high-energy fat. The estimator computes the math. It converts physical dimensions into a body fat percentage. That gives you a number to help you plan your next fishing strategy or how to prepare the fish at the table.
How to Check if a Fish Is Healthy
Understanding Condition Factor This is where the condition factor comes into play. Condition factor is a comparison between weight and length. If it has a higher condition factor, it’s heavier then its length should be. That typically indicates a healthier fish that’s storing up energy. A lower number indicate a stressed or skinny fish.
Length and weight aren’t the whole story. There’s another part of the equation: girth. To get the girth, you’ll want to measure the fish around middle. Right in back of head is the deepest point. From there, you can tell whether it’s a big-framed fish or simply a plump one. No girth, no guessin’. The calculator use girth measurement to check species specific ratios. Is it really thick or just wide-shouldered?
The water conditions change with season. That’s where you use the estimator. You can choose the time of year. For example, an October walleye will have more fat than a June walleye. It takes away weight of reproduction if you’re targeting fish in the pre-spawn period. Because they are full of milt or eggs, they look like huge fish. But they’re not necessarily fatty. It takes out all that extra temporary breeding weight and estimates their true energy reserves in their flesh. That’s important when comparing fish at various times of the year.
It also explain why some spots produce thinner fish. So the baseline health depends on forage availability. Forage rich systems mean less work from fish to obtain their meals. They also is better at converting what they get into body condition. Lean waters make them wiry and efficient. The feeding state gives you an adjustment for both of those forces. But it’s not like just the fish. It’s a measure of the lake too. When crowded populations has fewer resources, the reserve score decreases. That shows the stress that competition create.
And then it all layers into something that becomes more realistic than just a simple weight-to-length formula could of ever give you. You get back a percentage. Plus, it tells you how it reached that number by providing a breakdown of the logic and a reserve score. These is not lab-grade precise numbers. Think of them as field estimates. That said, they allow you to compare one fish to the next in a consistent manner. To ask, was this year’s catch better than last? Is one lake producing better-quality fish then another? Those data points allow those questions to have a common language.
Reference the tables on the page to see where yours fall. If you have a high reserve score on a trout maybe you caught a late-fall feeder. On a pike it might be a trophy that lorded over the local food base. The numbers provide a measure of the fish’s body fat, which is a clue into the fish’s story. It is a clue about the health of the ecosystem. It is a clue about where he is in his biological cycle. It is a clue toward how good this might be for a meal.
Next time you’re staring at a flat-belly bass, flash back to those numbers. Now you know what your gut was saying. Now you can measure fish that feel right. And the gap between the lean runners and the rich feeders is often just a few points of body fat. Those are the margins that make all the difference.