Species Diversity Index Calculator
Convert fish catch counts into Shannon diversity, Simpson diversity, evenness, richness, and dominance for a cleaner read on sample balance.
📌Survey presets
⚙Sample settings
🔢Species catch counts
Diversity index results
Full breakdown
📋Species and gear grid
Rod Catch
Seine Haul
Electro Pass
Trap Set
📚Diversity reference tables
| Index | Formula | Best read | Fishing survey note |
|---|---|---|---|
| Shannon H prime | -sum p ln p | Richness plus balance | Good for mixed catches |
| Simpson 1-D | 1 - sum p squared | Chance two fish differ | Less moved by rare catches |
| Inverse Simpson | 1 / D | Effective common species | Useful when one group dominates |
| Pielou J | H prime / ln S | Evenness only | Best when richness differs |
| Margalef | (S - 1) / ln N | Richness by sample size | Needs enough total fish |
| Shannon H prime | Evenness J | Typical interpretation | What to compare |
|---|---|---|---|
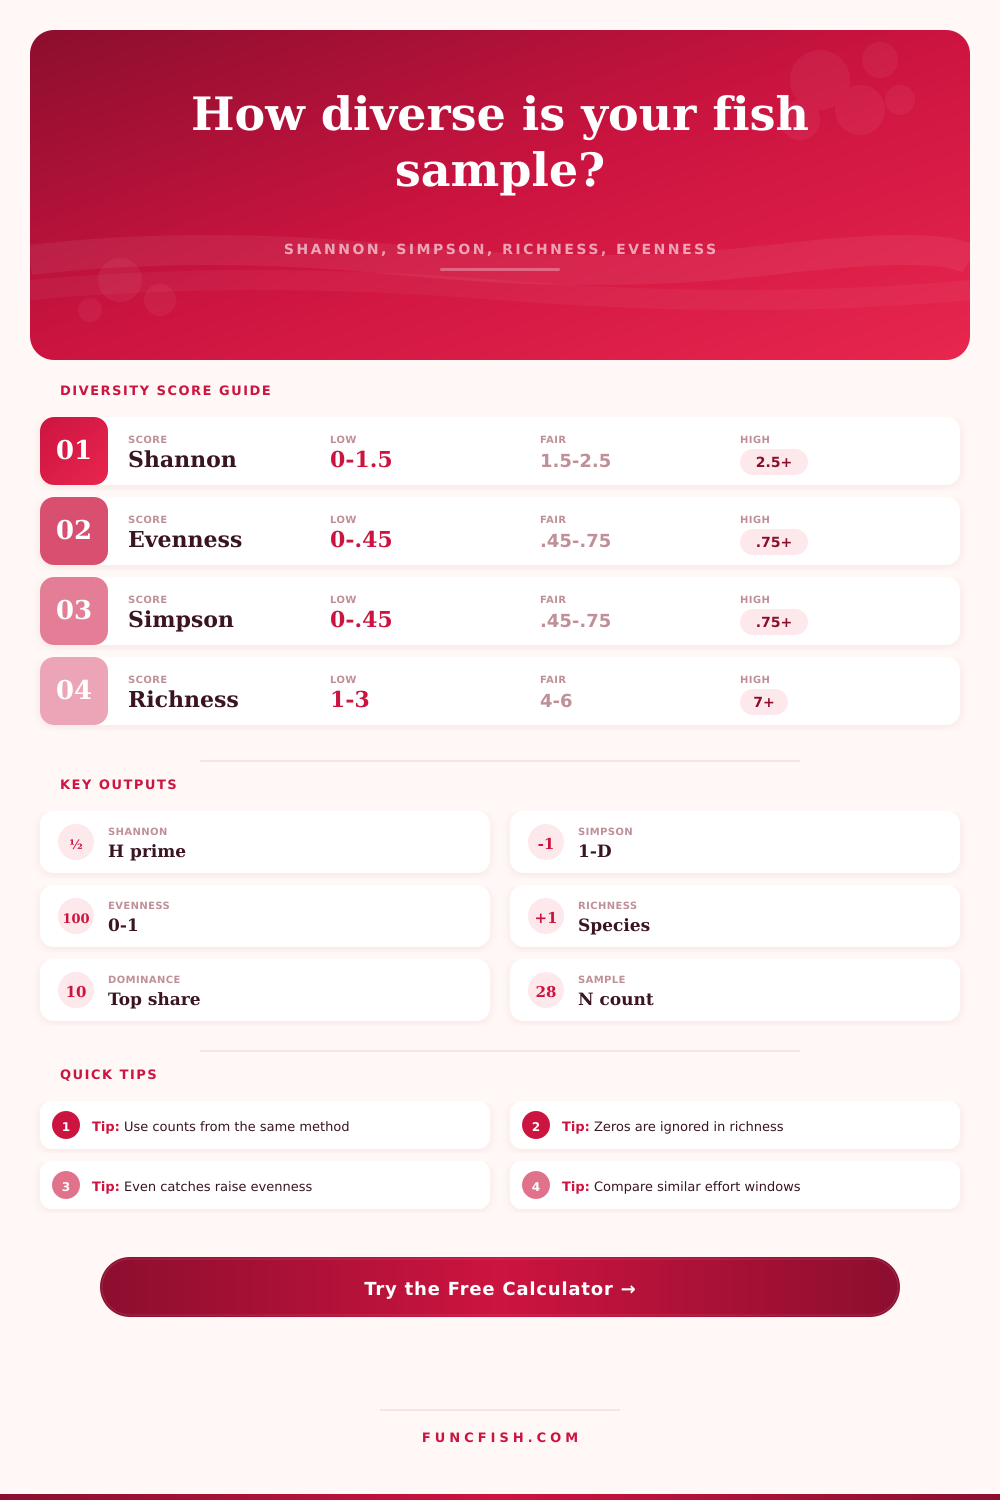
| 0.00 to 1.50 | 0.00 to 0.45 | Low diversity or strong dominance | Check gear bias and season |
| 1.50 to 2.50 | 0.45 to 0.75 | Moderate mix of fish groups | Compare similar water types |
| 2.50 to 3.50 | 0.75 to 0.90 | High balance across species | Watch rare species consistency |
| 3.50 plus | 0.90 plus | Very broad, very even sample | Verify IDs and sample coverage |
| Water type | Likely richness | Effort benchmark | Common caution |
|---|---|---|---|
| Pond / small lake | 3 to 7 species | 2 to 6 angler-hours | Stocked fish can dominate |
| Stream / river reach | 5 to 12 species | 300 to 1000 ft reach | Habitat changes quickly |
| Large lake basin | 6 to 18 species | Multiple stations | Depth zones shift catch |
| Inshore creek | 8 to 20 species | Tide-matched passes | Juveniles inflate richness |
| Offshore reef | 10 to 30 species | Repeat transects | Gear selects active feeders |
| Gear type | Count strength | Species strength | Index caution |
|---|---|---|---|
| Rod and reel | Active feeders | Game fish | Under-counts small forage fish |
| Seine haul | Small fish schools | Forage and juveniles | Misses deep or fast cover |
| Electrofishing | Reach comparison | Shallow freshwater | Efficiency varies by water clarity |
| Trolling transect | Open water predators | Pelagic species | Lure selection shapes the sample |
| Trap set | Bottom-oriented fish | Catfish, minnows, sunfish | Soak time changes catchability |
💡Practical checks
Tip: Run diversity comparisons on samples taken with the same gear, season, and effort window whenever possible. Mixed methods can be useful, but method changes often move the index as much as the fish community does.
Tip: Keep zero-count species out of richness, but keep the same named count slots when comparing trips. That makes changes in dominance and evenness easier to track.
Take a pond. You go out there, pull up a bucketful of fish. What are you going to find? You will find forty largemouth bass and one lonely bluegill. There is a lot of weight. There is not much diversity. And diversity is what separates a healthy environment from a monoculture. It is abundance versus variety.
Many people will look at numbers or weight totals when they go fishing. It’s simple math. But what does it say about the health of the body of water? It’s about balance, not just biomass. It’s also about balance.
Why Fish Balance Matters
So all you have to do is input the counts for each species you identified and the calculator will run numbers for you. When you put data from your rod or net in there, it spits out those standard indices like Simpson and Shannon. What’s great about it is you don’t have to be a stat guy to use it. You just has to know what goes into it.
It wants specific counts per species you identify. So if you had a mixture of ten panfish and ten bass, that is evenness, and the system recognizes that as being perfect. But then if you had one panfish and ninety nine bass that would be a case of dominance. The system does the squares and logarithms for you so you can spend time looking at the pattern.
And that is where folks screw up. A big number is a good number they think, but they fail to realize that only one species is dominating the others. These measurements include Shannon diversity. That’s the combination of two things: richness (the number of unique species) and evenness (how evenly those species are represented). A pond with five different species where one species make up 90% of your catch will have less Shannon diversity than a pond with five species where each makes up 20%.
Why does this matter? Because a dominated ecosystem is typically not as resilient. The entire community collapses when that one dominating species become ill, or water temperatures change, stressing that species. A balanced community contains buffers. You can track its resilience over time with a single number, the Shannon index.
Simpson diversity also uses an approach that is less sensitive to rare species. What’s the chance that any pair of individuals chosen randomly from a sample set come from two different species? Compare that to Shannon: If you get one species that only appears once every hundred samples, Simpson diversity hardly notices. A little more weight for that strange outlier that showed up in your net; Shannon diversity gives it that.
That’s laid out nicely on the page in the reference table, which shows how various indices respond to different types of sampling structure. Simpson, maybe you’re interested in the heart of the community, those fish who really make things happen. Maybe Shannon is for when you are concerned with the periphery, the rare species that tell us something about ecological breadth.
The most intuitive result is probably evenness. Evenness scores range between zero and one. Near one? All the species are about equal in abundance. Near zero? One species dominates all others.
Richness is just the number of species. But that’s tricky because the sample size may have been low. The fact that I caught three species in five minutes doesn’t necessarily indicate there are only three species in the pond. It indicates my effort was low.
And that’s where the tool comes into play, allowing you to log how much effort went into your sampling (e.g., transect length, angler hours). Because without that context, a ten minute cast is being compared to a six hour electrofishing survey. Apples and oranges.
The silent killer of accurate diversity data is gear bias. Catching fish on a rod and reel skews towards larger game fish and those actively feeding. Seining catches juvenile and smaller schoolers roaming open water. Electrofishing is ideal for shallow freshwater bottom-dwelling species. This calculator has preset options for the most common survey types, helping you make your approach consistent.
Switching from trolling to seining mid-trip will result in a different diversity index while leaving the fish population unchanged. It is not just the fish, but also the method used to select them. To track real changes in the ecosystem, you must keep your gear consistent.
The dominance metrics let you know who’s winning. The Berger-Parker index will tell you what percentage of the most common species are present. A high Berger-Parker means your ecosystem is vulnerable. High dominance means there may be a lot of stress on the environment, such as overfishing. It also could of mean that an ecosystem is under pressure from invasive species. In general, low dominance (high evenness) means a healthy and stable system. A lot of niches are being filled.
It’s a little thing. But it matters. Over time. Whether seasons or years… Watching those trends shows more than a snapshot ever would. You’ll see a decline in evenness well before losing entire species.
So don’t go chasing a perfect score. Mother nature messes up. Every habitat has its own baseline. For example, a muddy bayou is going to show diversity different than a rocky stream. So the tool gives you a benchmark to help you interpret your results, but you need to know your water. Compare similar spots. Follow the changes in the same spot over time. Don’t compare a reef with a pond.
Follow the subtle shifts the eye doesn’t pick up. That’s the value of measuring what you can see so you can protect what you cannot. The numbers tell you when the balance tips first.