Fish Waste Percentage Calculator
Estimate usable fish, natural processing waste, discard weight, and retained byproduct from species yield, cut target, catch condition, trim style, and whole-fish weight.
📌Waste estimate presets
⚙Catch and processing inputs
Waste percentage estimate
Natural non-target material plus drip, damage, and trim.
Estimated target cut weight from the measured batch.
Remaining waste after retained byproduct is credited.
Heads, frames, skin, or other usable non-fillet material.
Calculation breakdown
🐟Species yield grid
Black Bass
Trout
Salmon
Walleye
Panfish
Catfish
Snapper
Tuna
📊Waste and yield reference tables
| Species group | Skinless fillet yield | Skin-on yield | Dressed yield | Typical waste driver |
|---|---|---|---|---|
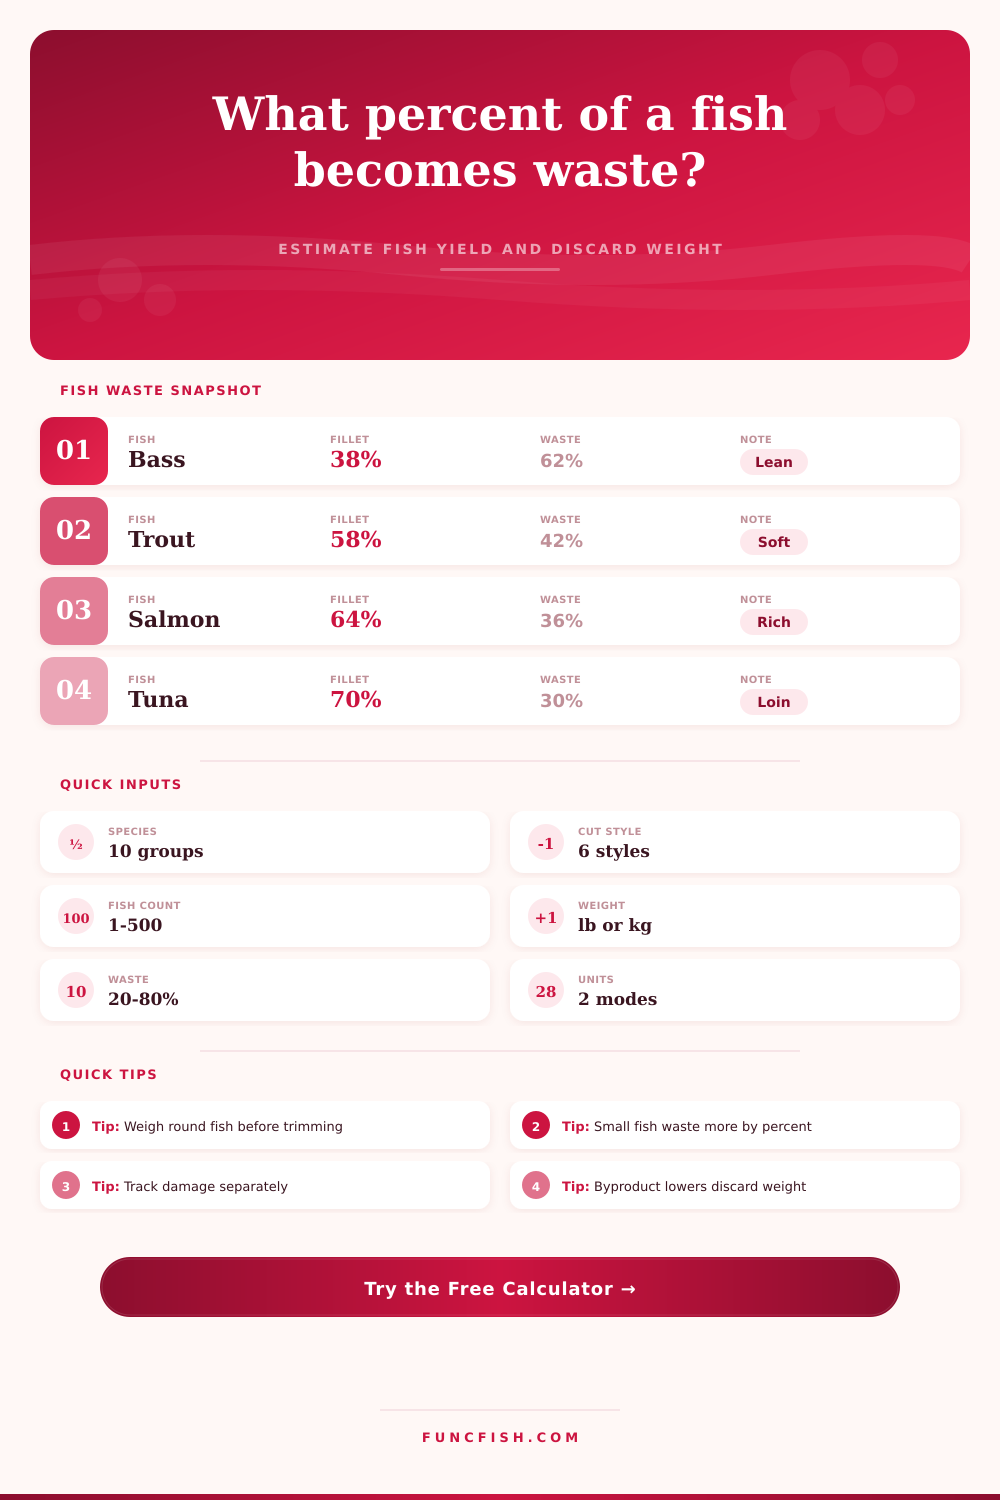
| Black bass | 38% | 42% | 86% | Head and frame percentage |
| Trout or char | 58% | 64% | 88% | Soft flesh and belly trim |
| Salmon | 64% | 68% | 90% | Pin bones, belly, skin choice |
| Walleye | 42% | 46% | 86% | Rib cage and small-fish ratio |
| Panfish | 32% | 36% | 82% | Head size relative to fillet |
| Catfish | 40% | 44% | 84% | Skinning and belly trim |
| Redfish or drum | 42% | 47% | 86% | Ribs, scales, shoulder trim |
| Snapper or reef fish | 39% | 43% | 85% | Large head and frame bones |
| Halibut | 50% | 54% | 89% | Large frame and skin choice |
| Tuna or pelagic | 70% | 72% | 92% | Loin trim and bloodline |
| Processing target | Yield effect | Waste effect | Best matched species | Calculator treatment |
|---|---|---|---|---|
| Skinless fillets | Baseline | Higher skin and trim waste | Bass, walleye, panfish | Uses skinless fillet percentage |
| Skin-on fillets | +4% to +6% | Less skin discard | Trout, salmon, redfish | Uses species skin-on recovery |
| Butterfly fillets | +2% to +4% | Less frame loss on small fish | Trout, panfish, small bass | Adds a modest yield credit |
| Steak cuts | +6% to +9% | Some bone remains in cut | Tuna, salmon, halibut | Credits retained center cuts |
| Dressed whole fish | 82% to 92% | Mostly viscera and drip | Trout, snapper, salmon | Uses dressed-yield pathway |
| Loin-style trim | -2% to +1% | Bloodline trim may rise | Tuna and larger pelagics | Applies focused trim logic |
| Scenario | Default drip | Damage allowance | Waste pressure | Planning note |
|---|---|---|---|---|
| Ice slurry kept catch | 1% | 0% | Low | Best basis for repeatable yield logs |
| Same-day cooler catch | 2% | 1% | Moderate | Default recreational batch setting |
| Shore bucket mixed fish | 3% | 3% | Moderate high | Small size spread often raises trim |
| Surf zone sandy handling | 2% | 4% | High | Scale loss and bruising can add rejects |
| Kayak inshore harvest | 2% | 2% | Moderate | Limited cooler space may add loss |
| Charter mixed-catch box | 2.5% | 3% | Moderate high | Mixed species need conservative yield |
| Warm day delayed processing | 4% | 5% | High | Use only as a loss-planning estimate |
| Measured round fish lot | 0.5% | 1% | Low | Good for market-style yield records |
| Waste component | Typical share | Can be retained? | Higher in | Calculator role |
|---|---|---|---|---|
| Head and collar | 10% to 25% | Often | Snapper, panfish, bass | Largest byproduct recovery lever |
| Viscera and blood | 7% to 14% | Usually no | Full-bellied fish | Counts as discard in every setting |
| Frame and ribs | 12% to 32% | Often | Bass, walleye, snapper | Scales with selected cut target |
| Skin and scales | 2% to 8% | Sometimes | Catfish, redfish, salmon | Drops when skin-on cuts are selected |
| Trim and drip | 1% to 12% | No | Warm, bruised, small mixed fish | Added from condition and scenario |
💡Waste estimate tips
Keep the basis consistent: Compare trips using the same starting weight. Round fish, bled fish, and already gutted fish all produce different waste percentages.
Separate waste from recovery: Process waste shows what does not become the target cut. Discard weight is lower when heads, frames, or skin are retained for another use.
“Man, I caught some nice ones,” you say as you bring them home. “I’m accomplished.” That thought quickly turns sour when you start cleaning. Water runs out, fish lie on the cutting board and then you see what you have left; it’s not nearly as much than you had when they were alive. Here is where the fish waste percentage calculator come into play. It fills the gap between what the fish weighed while alive and how much meat you can use.
Most folks estimate they lose twenty percent or maybe thirty percent, just for their guts and heads but in reality, it’s frequently more. This is especially true when you consider blood lines, trim, skin, and frames.
How the Fish Waste Calculator Works
The first big variable are species. You can’t assume that your yield will be the same for every fish. Estimate yield with a tuna and you won’t get the same amount as a trout. Muscular ocean fish like tuna feature dense loin sections with a high recovery rate. Softer-fleshed fish like trout feature more belly trim with a higher percentage of waste. The calculator take these biological differences into account and adjusts its base yield assumptions to match. By choosing a species, you’re instructing the system how much to expect in terms of non-target tissue and structural bone.
Yes, size matters, but also anatomy. A little panfish may be small but its head is large compared to its body and therefore it wastes a lot of weight. Conversely, a large bass has a much better meat-to-bone ratio but its rib cage still cuts down on the overall yield a bunch.
It also depends on how you intend to cut the fish. For example, if you’re aiming for steaks (or even skinless fillets), the amount of waste will be different than if you’re going for dressed whole fish. Different amounts need to be removed for each type of final product. Removing skin produces more waste, as with skinless fillets. With steaks, some bone and connective tissue remains, reducing the apparent waste percentage but changing the eating experience. To account for that trade-off, the calculator change its math to match. In the case of a standard trim, it’s assuming a normal home cooking situation. For a close trim, it considers the additional loss incurred by carefully removing bloodlines and pin bones, an important consideration for precision cooks who value both texture and presentation.
Yield can be affected by other factors as well. If the fish are bunched up in a net or have been sitting in a cooler for to long, they can become soft and bruised. There’s also a setting for catch condition which lets you add a percentage to the calculator for delayed processing or warm days. Soft fish tear when being filleted. Uneven cuts and ragged edges mean more meat lost. Not a big deal, but when you’re trying to make the most out of each ounce… it counts. Based off catch conditions, the calculator includes some amount of damage and drip loss. A true-to-life view into how much meat ends up in your compost bin or garbage can vs. On the plate.
Tracking byproducts is one of the more valuable aspects. Not all waste needs to be considered “waste.” The frames may go to the pets or the heads may become stock; so they aren’t really wasted. The calculator distinguishes between what’s retained (byproducts) and what’s not (true process waste). That allows you to understand how much is really eaten and what you’re re-purposing. It changes it from a basic subtraction equation to an exercise in resources. You begin thinking in terms of the whole animal instead of just fillets. This can make you less wasteful, less guilty about scraps, and save you money as well.
The other thing that people don’t consider is the unseen loss. Scale loss, blood loss, drip loss all add up fast. These are spelled out in the reference tables on the page for each species group. Salmon can reach as high as sixty-four percent fillet yield where black bass may only be thirty-eight percent. Those are some stark numbers. But they help explain what happens when you catch a ten pound bag of fillets and end up needing fifteen or twenty pounds of whole fish. Knowing this ahead of time will keep you from being disappointed when you get back with less food than expected. It’ll also help with cooler space planning or your next trip to the grocer. Now you know how many fish you have to catch to fill the family bellies.
So what’s the point? Waste percentage isn’t about being an elitist snob; it’s about respect. The resource. And by having that number, it takes the guessing out of cleanup. Instead of sitting there thinking, “Why do I always have scraps?” you can see what happened. You have a model of what happened. The tool manages all those complicated variables for you while you manage the cooking.
So now you’re weighing the catch, entering the data, and getting a number based off reality. And that clarity is worth something. There are fewer surprises at mealtime, a more efficient flow throughout your kitchen, and a better understanding of what you’ve harvested. The fish didn’t change. But the expectation has changed.
You should of used this sooner to avoid being surprised by the amount of meat you actualy get. It would of been much easier too! This moddern way of looking at things helps people feel more comfortabley with their catch and makes the process naturaly better.