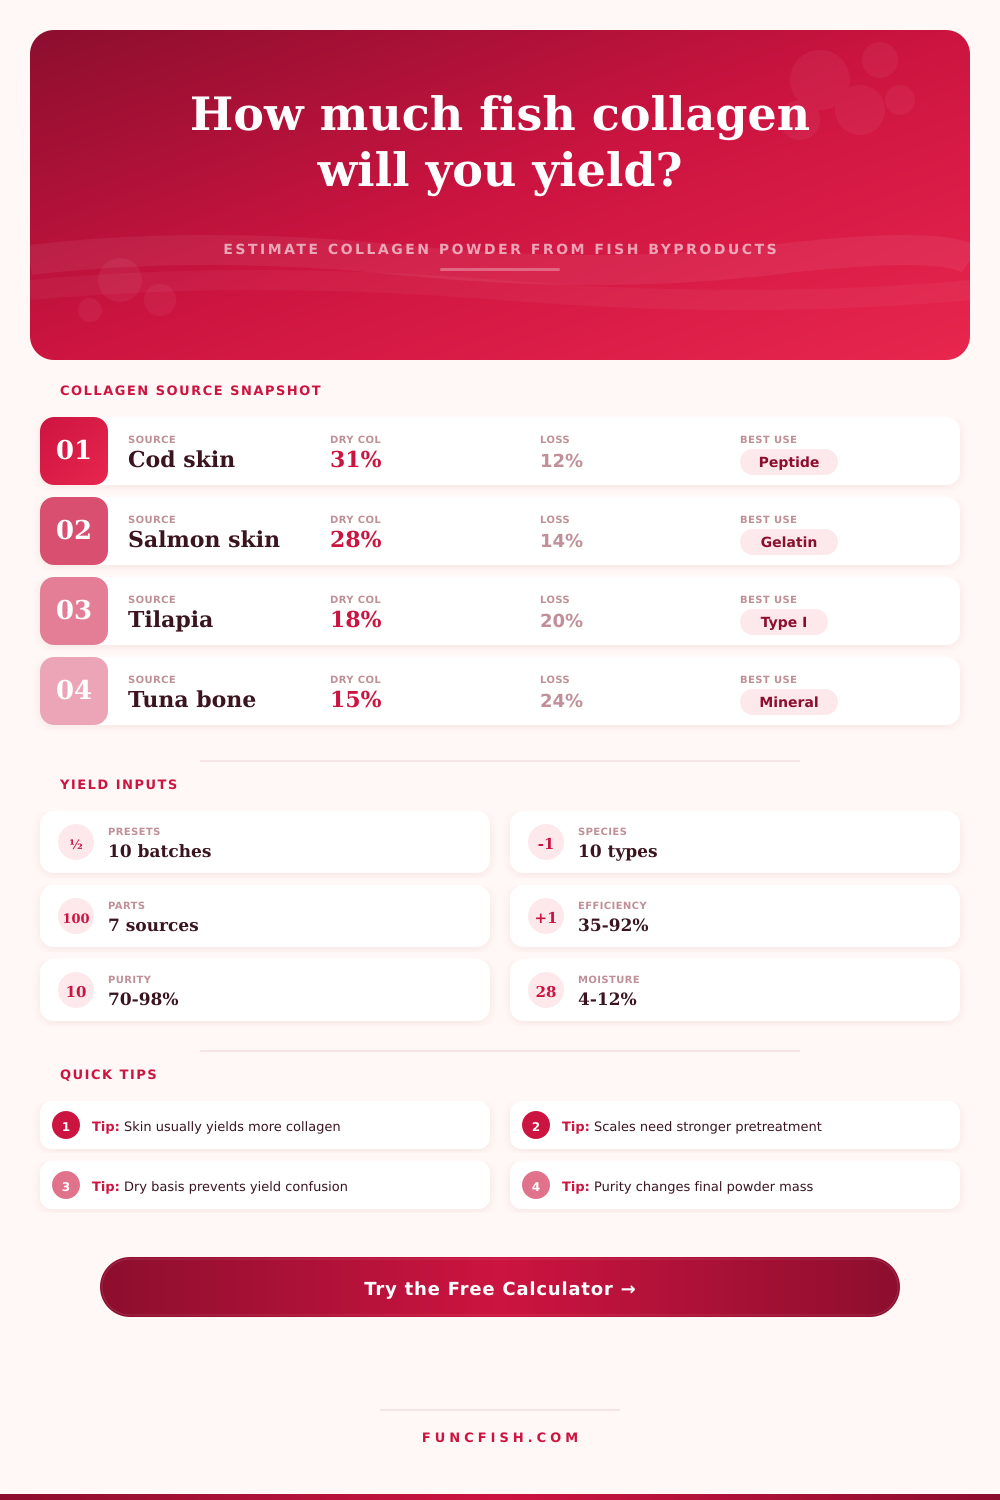
Fish Collagen Yield Calculator
Estimate collagen recovered from fish skin, scales, bone, swim bladder, or mixed trimming material using species data, moisture, pretreatment losses, extraction efficiency, purity, and final powder moisture.
📌Collagen yield presets
⚙Batch inputs
Fish collagen yield estimate
Calculation breakdown
🐟Species collagen grid
Cod skin
Salmon skin
Tilapia scale
Tuna bone
📊Reference tables
| Source part | Typical dry collagen | Common moisture | Processing note |
|---|---|---|---|
| Fish skin | 24% to 34% of dry matter | 62% to 72% | High-yield source with limited mineral removal. |
| Cleaned scales | 13% to 22% of dry matter | 28% to 42% | Often needs demineralization before extraction. |
| Frames and bone | 10% to 18% of dry matter | 42% to 55% | Mineral fraction lowers collagen yield by wet weight. |
| Swim bladder | 30% to 42% of dry matter | 70% to 80% | Collagen-rich but typically limited in volume. |
| Fins and tail | 16% to 26% of dry matter | 48% to 60% | Cartilage and skin mixture gives moderate yield. |
| Process profile | Efficiency range | Purity range | Best matching source |
|---|---|---|---|
| Acid-soluble collagen | 45% to 70% | 78% to 92% | Fresh skin or swim bladder. |
| Pepsin-assisted collagen | 60% to 86% | 82% to 95% | Cross-linked skin, scales, and fins. |
| Hot-water gelatin | 55% to 82% | 72% to 90% | Skin, bone, and mixed trimmings. |
| Enzymatic peptide hydrolysate | 68% to 92% | 80% to 96% | Purified collagen or gelatin feedstock. |
| Demineralized bone collagen | 35% to 62% | 70% to 88% | Frames, heads, collars, and bone-rich lots. |
| Species | Best source | Dry collagen guide | Batch interpretation |
|---|---|---|---|
| Cod and pollock | Skin and frames | 22% to 32% | Lean whitefish skin often dries cleanly. |
| Salmon and trout | Skin | 24% to 30% | Oil removal can raise pretreatment loss. |
| Tilapia and carp | Scale or skin | 16% to 29% | Scale lots need mineral correction. |
| Tuna and mackerel | Bone and skin | 12% to 27% | Mixed lots vary with frame-to-skin ratio. |
| Barramundi and snapper | Skin and swim bladder | 26% to 40% | High-grade sources suit purified collagen runs. |
| Finished grade | Moisture target | Purity assumption | Yield effect |
|---|---|---|---|
| Crude dried collagen | 8% to 12% | 70% to 84% | Higher mass, lower purity correction. |
| Food-grade powder | 5% to 10% | 82% to 92% | Balanced recovery and specification control. |
| Gelatin flakes | 8% to 14% | 72% to 88% | Thermal extraction can lift apparent recovery. |
| Hydrolyzed peptide powder | 4% to 8% | 85% to 96% | Hydrolysis raises solubility but loses solids. |
| Lab-purified collagen | 4% to 7% | 90% to 98% | Strict purification lowers finished mass. |
💡Yield notes
Dry basis matters: compare collagen yield against dry, cleaned material when testing species, extraction methods, or source parts. Wet-weight yield can look low when the starting material has high moisture.
Use purity deliberately: if a protein assay reports 88% collagen in the recovered powder, the calculator separates pure collagen equivalent from the final powder weight.
The fish market produces quite a bit of waste that gets tossed into the processing bin. However, there is still protein resource buried in this wet mess. It has the potential to be worth far more then garbage pickup fees.
How many pounds of collagen can you extract from tuna frame? What about cod skin? The answers aren’t always simple. It depends on your process assumptions, such as how much material is lost during cleaning or how much water you are towing around. It also depends on the purity grade you want and which species you is working with.
Why Moisture Matters in Collagen Extraction
That’s where our calculator comes in: plug in some assumptions about your process, pick your species, and let us do all the heavy lifting for you… No unit conversions or manual stoichiometric equations required.
The one big variable that’s going to trick you into believing you have more product than you actualy do is moisture content (so start there). By weight, fish skin can contains up to almost seventy percent water. Without correcting for this moisture, your yield calculations are based off your starting material’s wet weight. The math won’t work; your economics are going to fall apart before you even get started extracting.
Strip that moisture out of your mental equation and look at the true potential of dry collagen. This is where many people goes wrong as beginners. They see a hundred pounds of skin and imagine a big yield, but they forget that most of its mass will either drain away or evaporate long before it turns into powder.
Beyond the species itself, choosing your source makes a big difference. Scales need heavy pretreatment to strip out minerals. Skin typically provide a higher yield, though you will see lower yields using bone. This means pretreatment loss inputs on the tool matter since an acid or alkali bath dissolves both the unwanted grit and non-collagen component.
And if you’re starting with a mix of trimmings off a filleting line, it’s going to vary even more, so the safety allowance settings help guard against overloading your plan by leaning into it. It is best to be cautious at first rather than realizing halfway through your batch that your assumptions about inputs was too optimistic.
The factory floor is where theory meets practice through process efficiency. Breaking down with enzymes might yield better overall recovery then either acid-soluble extraction or hot-water gelatin extraction; but it may also yield less pure product. Every process has its own ceiling of efficiency. Depending on what market you’re targeting, you’ll be trading off quality for quantity.
Want to use these products as food grade peptides? Well, you want that high purity. So you accept lower mass recovery. And the reference tables on the page makes all this clear: Which methods work best for which raw materials? There’s no such thing as the best method; there is only the method that matches the raw material you’ve got in hand.
Finally, don’t overlook the last step: Drying. In planning, one of the target numbers that will be hammered out in negotiation is the moisture content in the finished product (powder). If your product is a bit moister then planned, it could be less expensive to manufacture and more manageable to work with, but it means fewer grams of actual collagen per gram of product. If you allow that number to inch upward too far, you’re starting to sell water. Adjusting this last variable can shows the impact on the final finished weight.
It’s used because it works. Knowing how many grams of wet collagen have been transformed into dry, sealed-bag collagen is the difference between having fun or running a business.
The rubber hits the road in the pilot batches. Run through a couple of what-ifs, and use the calculator to model out your results before spending money on a full run. Compare the results of an enzymatic break vs. Using acid for extraction. See how different yields compares between stored material vs. Fresh skin. Where do those margins lie? What can the numbers tell you? You may discover that a process with a lower yield but higher purity will command a better price at market and make up for the lost volume. That is the kind of insight you get when you are running the math right.
So what’s it all about? We turn waste into value with precision. Fish collagen extraction isn’t just chemistry. It’s also economics, logistics and a bit of patience. Knowing what makes the yield happen stops the guessing game and puts you on the road to manufacturing.
Knowing precisely how much of that pure protein will make its way from the wet bin to the final package can mean the difference between success and failure. Respect those losses, keep that moisture in check and let the data lead you to the next batch.