Lake Trophic State Index Calculator
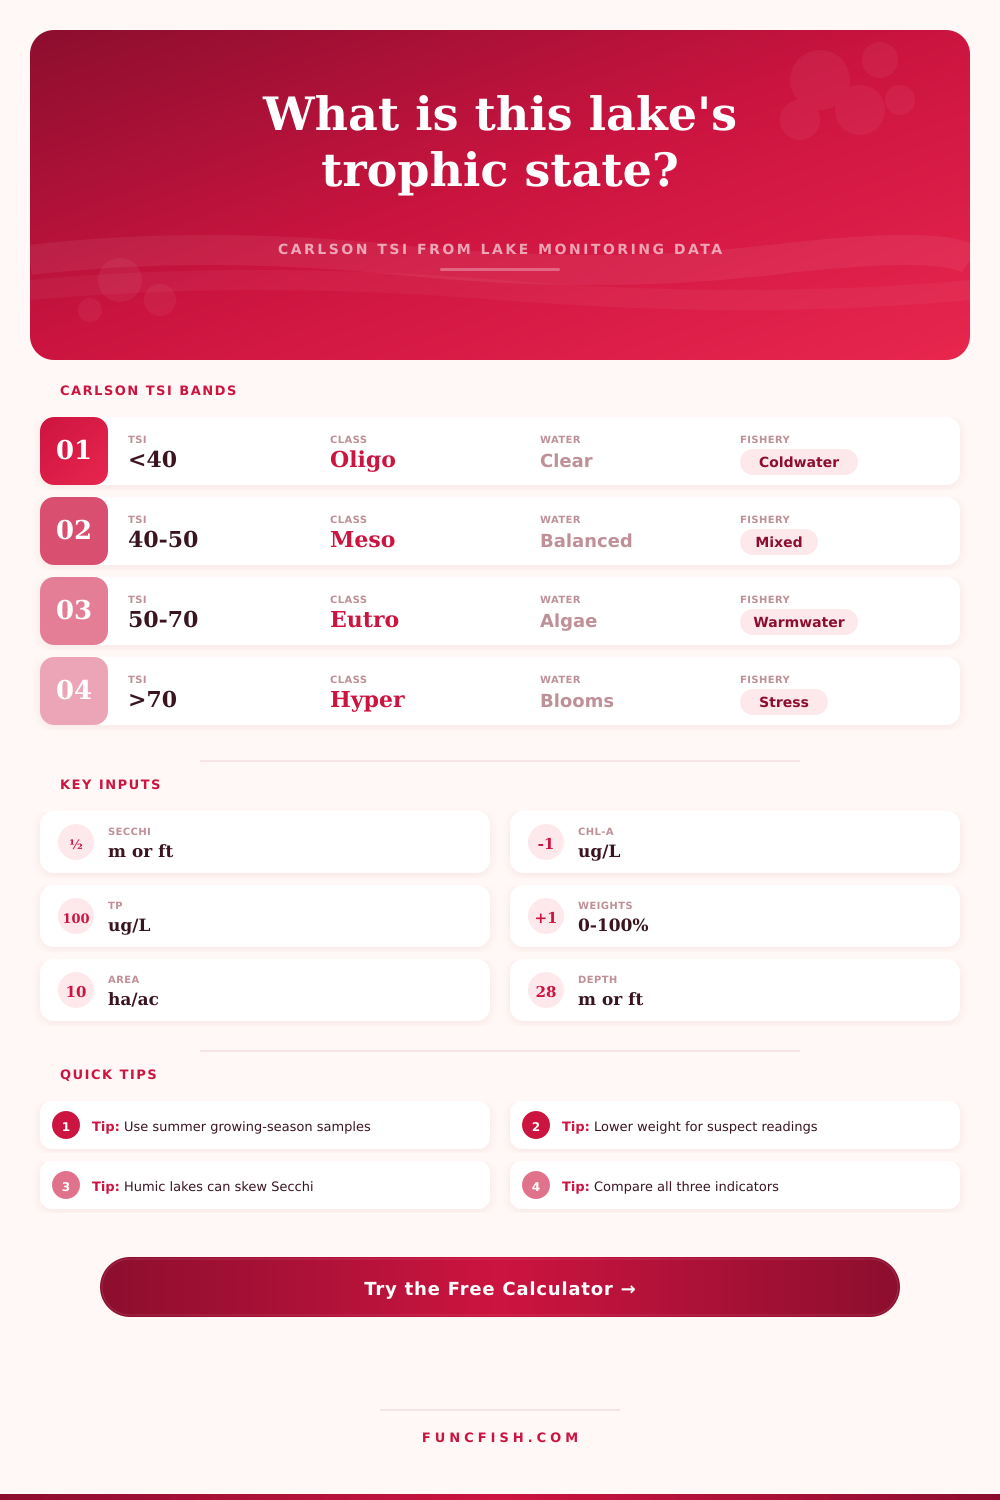
Estimate Carlson TSI from Secchi depth, chlorophyll-a, and total phosphorus, then weight each reading by confidence for a clearer lake and fishery interpretation.
📌Named lake presets
Presets are illustrative monitoring scenarios for named lake types. Replace them with your current sample results before making management decisions.
⚙Monitoring inputs
Lake trophic state forecast
Formula breakdown
📋Indicator result grid
Secchi depth
Chlorophyll-a
Total phosphorus
Confidence
🐟Trophic and species grid
Oligotrophic
Low algae and clear water. Trout, salmonids, cisco, and coolwater predators may benefit where oxygen stays deep.
Mesotrophic
Moderate productivity. Often supports bass, walleye, perch, panfish, and mixed coldwater refuges in deeper basins.
Eutrophic
High nutrients and greener water. Warmwater bass, pike, panfish, catfish, and carp usually tolerate conditions better.
Hypereutrophic
Frequent bloom pressure. Fishery risk shifts toward low oxygen, summer kills, rough fish dominance, and poor sight feeding.
📚Reference tables
| Carlson TSI band | Trophic state | Typical water signal | Fishery signal |
|---|---|---|---|
| Under 30 | Ultra-oligotrophic | Very clear, very low algae | Low forage production, coldwater refuge likely |
| 30 to 40 | Oligotrophic | Clear water, low nutrients | Coldwater or clear-water sportfish potential |
| 40 to 50 | Mesotrophic | Moderate clarity and algae | Balanced mixed fishery productivity |
| 50 to 60 | Lower eutrophic | Green tint, occasional blooms | Warmwater productivity rises |
| 60 to 70 | Eutrophic | Dense algae, reduced clarity | Summer oxygen stress becomes important |
| Over 70 | Hypereutrophic | Frequent blooms and scums | Fish kill and habitat compression risk |
| Indicator | Carlson formula | Input unit | Interpretation caution |
|---|---|---|---|
| Secchi depth | TSI(SD) = 60 - 14.41 x ln(SD m) | meters after conversion | Color and suspended clay can lower clarity without algae |
| Chlorophyll-a | TSI(Chl) = 9.81 x ln(Chl ug/L) + 30.6 | ug/L or mg/m3 | Blooms can be patchy across bays and wind lanes |
| Total phosphorus | TSI(TP) = 14.42 x ln(TP ug/L) + 4.15 | ug/L after conversion | TP may predict bloom potential more than current algae |
| Weighted TSI | Sum(TSI x weight) / Sum(weight) | valid indicators only | Large disagreement means the lake is not in steady state |
| Lake type | Secchi caution | Bloom modifier | Fishery interpretation |
|---|---|---|---|
| Deep clear natural lake | Usually strong | -4 TSI risk points | Deep oxygen can preserve coldwater habitat |
| Mixed natural lake | Usually balanced | 0 TSI risk points | Often supports mixed warmwater and coolwater species |
| Shallow polymictic lake | Bottom resuspension possible | +7 TSI risk points | Warmwater fish tolerate turbidity better |
| Reservoir / flow-through lake | Inflow turbidity possible | +2 TSI risk points | Productivity varies strongly by arm and inflow |
| Stained humic lake | Color can depress Secchi | -2 TSI risk points | Brown water may not mean algae-dominated production |
| Urban pond / small impoundment | Short-term swings common | +8 TSI risk points | Oxygen crashes can happen quickly after blooms |
| Indicator disagreement | Meaning | Likely cause | Calculator response |
|---|---|---|---|
| 0 to 8 TSI | Indicators agree | Stable sample window | High confidence if weights are high |
| 9 to 15 TSI | Moderate mismatch | Recent mixing, grazing, or inflow | Confidence is reduced |
| 16 to 25 TSI | Strong mismatch | Color, non-algal turbidity, or nutrient reserve | Read each indicator separately |
| Over 25 TSI | Unstable signal | Bad sample, active bloom patch, or unusual water color | Resample before firm interpretation |
💡Practical checks
Tip: Compare Secchi, chlorophyll-a, and phosphorus instead of relying on one number. A high TP score with modest chlorophyll often means bloom potential is present but not fully expressed during the sample window.
Tip: In stained humic lakes, down-weight Secchi if water color is natural. The calculator keeps Carlson formulas intact, but the weighted result should reflect sample confidence.
Water quality is something that concerns us all, but it’s hard to know what we should be concerned with or even how to quantify it. The Trophic State Index turns your subjective concern into objective data. Through this online tool, you can enter three separate indicators into a single understandable score. It gets you out from under the guessing game and paints a clear image of where the lake sit.
That’s why the Carlson TSI is effective, because it recognizes that one test isn’t enough to get the full picture. You could have very clean water with elevated phosphorus content that is ready to cause an algae bloom. Or you could have a short algae bloom that clears in the coming weeks. This calculator will do the math for you. But knowing what each input represent is where the real value lies.
How to Use the Trophic State Index
The oldest measure of water clarity is called Secchi depth. Basically, you drop a black and white disk in the water column until it becomes invisible. It is simple, inexpensive, and quite effective. That said, it’s also the most misleading. On naturaly stained lakes with tannins, the water might appear murkier then it actually is. This means you can weight that input based on confidence. This is a key characteristic of stained humic lakes.
Total phosphorus is potential energy waiting to be released. How much fuel do we have? Chlorophyll-a is the biological reality check. What’s growing right now? How much actual algae are in the water column? So when you see phosphorus high and chlorophyll low, you’re usually looking at a system that’s stable for now, but primed to bloom with the next warm spell or storm.
How does the tool resolve conflicting results from these indicators? The tool use a weighted average approach. It won’t pick the eutrophic or oligotrophic result at random if Secchi indicates one thing while phosphorus indicate another. Instead, it will weight the average based off your confidence in the readings.
Managing lakes is all about chaos. Lakes aren’t perfectly steady states. They changes with the weather, season, and their own sediment release cycles. Keep in mind that the shape of water body matters physically as well. For example, deep clear basins respond more slowly than a shallow pond to nutrient pulses. Wind mixes shallow water entirely so nutrients is always available for algae growth. Oxygen and nutrients in deep lakes can be stored in layers that do not interact until turnover. To account for this, we let you choose the lake type so that it adjust the meaning of the raw scores.
The other trap most folks fall into with TSI scores is considering it a final judgment. It’s a snapshot. If your score is fifty five, that tells you the balance between productivity and algae levels has shifted from productive (mesotrophic) toward more algal dominated (eutrophic). That will also change things for the fishery. Sight predators such as bass prefers clear water. Ambush predators and increased numbers of carp or panfish tend to favor green water. This is spelled out in the reference table at the bottom of the page. It shows how water clarity relates to probable fish communities.
In nutrient-poor waters, species needs a lot of oxygen and prefer cold water. In nutrient-rich waters, there is a risk of an oxygen crash in the summer that stresses or kills fish. This connection will help you predict what happens with management and why. Do you have a nutrient problem or a physical depth problem? Knowing makes a difference if you want better fishing.
Get a taste… When you get to take a sample, do it in prime growing conditions; that way you’re getting the most accurate picture. Winter ice hides issues. Spring turns over and thins out the messages. Summer heat makes everything about nutrients stronger. Only put high confidence weights on freshly collected samples taken correctly. Things tend to move in the field and if you mark those estimates with medium confidence you should of stayed honest to the outcome.
You’re not doing this for a number. You’re looking at the trend line of your lake. If you have a 3-year rise in TSI, that is cause for alarm and something to watch well before the water turns green. By monitoring those changes, you can react to them before they become permanent changes to the ecosystem.
The math provides the baseline. Your eye adds meaning to it. Together, it transforms vague worry into useful informaton.