Angler Pressure Sustainability Calculator
Estimate whether a fishery's annual catch, harvest, and release loss are staying inside the replacement capacity suggested by recruitment and access pressure.
📍Pressure presets
⚙Fishery inputs
Pressure sustainability readout
Calculation breakdown
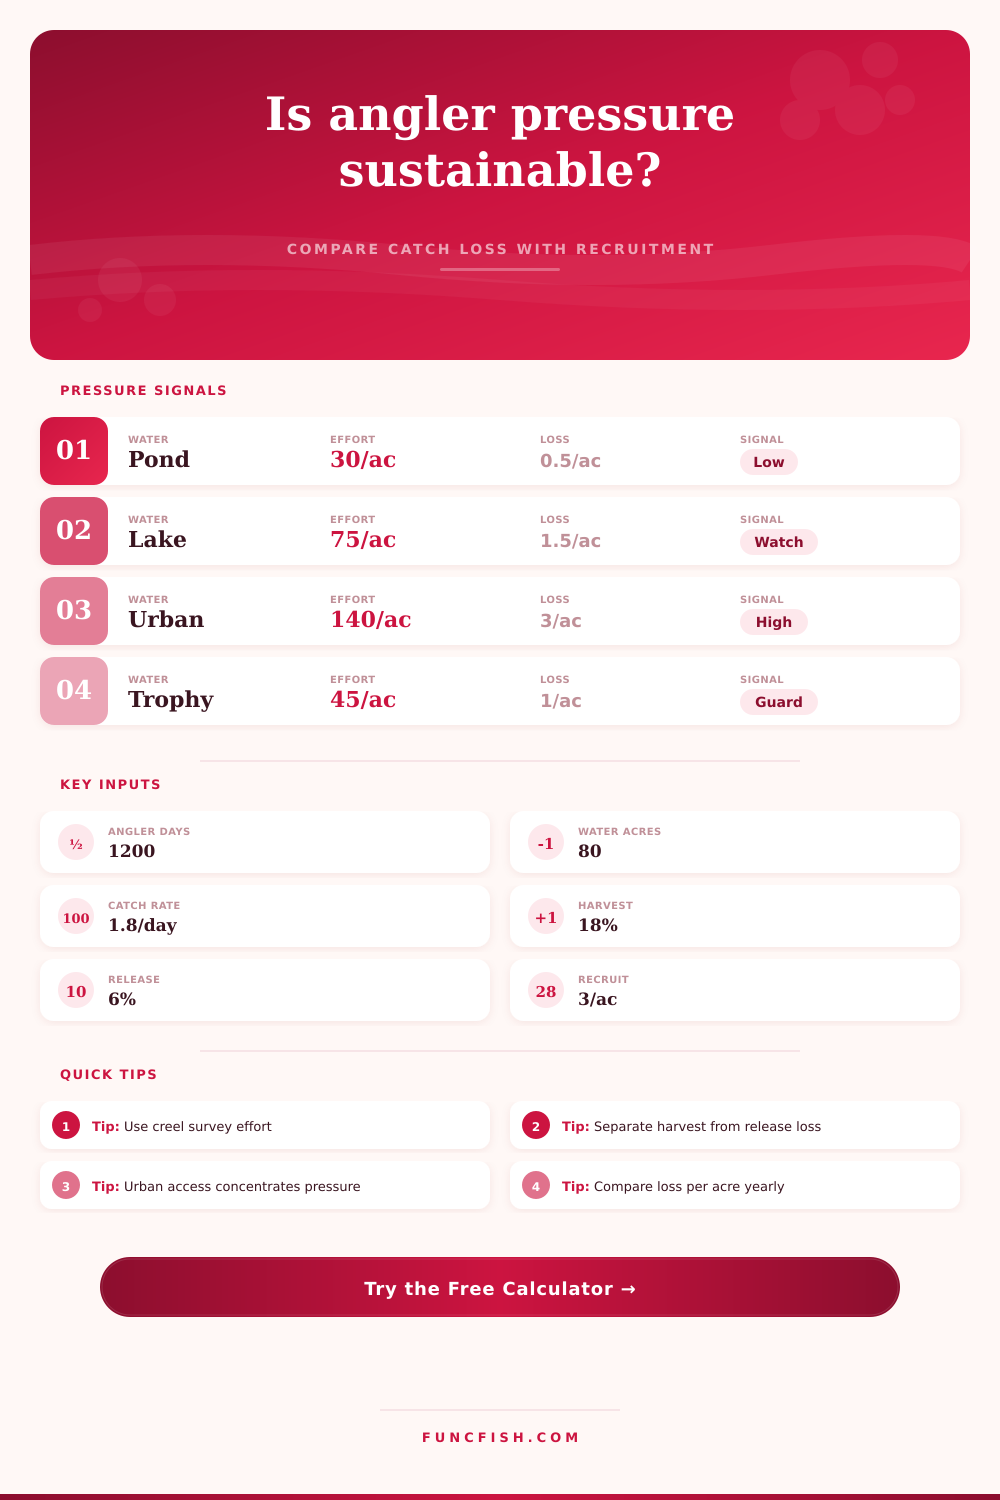
📊Pressure signal cards
📘Effort density reference
| Effort class | Angler-days per acre | Typical pattern | Management signal |
|---|---|---|---|
| Light | 0-40 | Remote lakes, limited parking, short bite windows | Watch trend data rather than one busy weekend |
| Moderate | 40-90 | Reliable local access with spread-out effort | Compare harvest loss against catchable recruitment |
| Heavy | 90-160 | Easy ramps, bank access, frequent repeat trips | Expect size structure to depend on release survival |
| Very heavy | 160+ | Urban ponds, seasonal runs, tournament clusters | Use access rotation, harvest limits, or stocking triggers |
⚖Mortality and recruitment guide
| Factor | Conservative value | Moderate value | What changes it |
|---|---|---|---|
| Harvest rate | 0-10% of catch | 10-30% of catch | Bag culture, fish size, legal harvest window |
| Release mortality | 2-5% released | 6-12% released | Temperature, depth, bait type, air exposure |
| Recruitment | 1-3 per acre | 4-10 per acre | Spawning habitat, stocking, forage, year class strength |
| Refuge share | 0-10% | 15-35% | Sanctuary water, weeds, distance, difficult shoreline |
🚤Access intensity modifiers
| Access intensity | Modifier | Pressure pattern | Best interpretation |
|---|---|---|---|
| Remote or limited entry | 0.75 | Fewer repeated contacts and more unpressured space | Full-acre averages are usually fair |
| Managed ramps or dispersed banks | 0.95 | Effort reaches several basins or shoreline zones | Use direct creel effort if available |
| Easy public access | 1.15 | Many short trips and repeat harvest opportunities | Check pressure near ramps separately |
| Urban, many access points | 1.35 | Catchable fish cycle through constant contact | Local depletion can appear before lake-wide depletion |
| Event concentration | 1.50 | High handling in narrow windows | Release mortality and refuge share deserve extra weight |
🐟Species pressure grid
Black Bass
Moderate resilience; heavy catch-and-release can still matter in heat or events.
watch handlingWalleye
Often harvest-sensitive because catchable recruitment can be pulsed by year class.
Trout
Coldwater refuges help, but warm releases and put-take harvest can change balance fast.
temp riskPanfish
High recruitment helps, yet repeated harvest can shrink size structure in small waters.
Catfish
Adult survival drives many fisheries; harvest of larger fish deserves separate tracking.
adult stockPike / Muskie
Low density and slow replacement make release mortality and trophy harvest important.
Redfish
Access concentration on flats can raise recapture pressure even across large acreage.
access zonesMixed Fishery
Use the most vulnerable target species when effort is focused on one part of the mix.
focus target🗂Species sensitivity table
| Species group | Recruitment pattern | Pressure concern | Useful trigger |
|---|---|---|---|
| Black bass | Moderate, habitat-dependent | Event handling and nesting season crowding | Deaths exceed 65% of recruits |
| Walleye / sauger | Variable year classes | Harvest of legal fish after strong hatches | Two weak recruitment years plus high harvest |
| Trout | Natural or stocked | Warm-water release loss and quick harvest pulses | Losses exceed planned stocking surplus |
| Panfish | High but size-sensitive | Harvest of larger adults in small ponds | Catch rate stays high but size falls |
| Pike / muskie | Low to moderate | Low adult density and delayed replacement | Any sustained adult loss above recruitment |
Tip: Use the narrowest reliable unit of effort available. For a large reservoir with one crowded bank area, run this calculator once for the whole water body and once for the pressured access zone.
Tip: Treat the result as a planning screen, not a population estimate. Real sustainability decisions should also use age structure, size trend, creel survey data, habitat condition, and local biology.
It’s obvious even before you wet a line. You can see it in the packed parking lot on Saturday morning, the trampled grass at the boat ramp, and the quiet sounds across a formerly productive waterbody. But recreational fisheries aren’t self sustaining machines. They’re biological systems with limited replacement rates. Just like logging a forest, they can be depleted just as fast. And the harvest occurs fish by fish. This makes depletion almost impossible to notice until bite shuts off.
Sustainability is rarely about a single bad day A big harvest isn’t sustainable Taking more fish from the water then are produced every year isn’t sustainable. The population contract. You may not notice it right away from number of fish being caught. But they’ll be smaller on average. Fewer of them will be keepers. More will seem stressed and unhealthy. Those things will start showing up. But the tool on this page help you see all that before it’s too late for fishery. Before it goes down the hole so far there’s no coming back. Your vague thoughts about “too many boats” will become something concrete, like a way to measure loss compared to replacement.
How to Keep Fish Populations Healthy
The harvest rate is percentage of caught fish that are actually kept. In other words, it’s the percentage of the fish we catch that we take home. Fishing habits and bag limits impacts this. There is a lot of conversation about release mortality, the unseen factor driving population change. Each time a fish is caught, there is some amount of hook stress. Each one is handled and exposed to air. Not all fish survive this. Even good release techniques result in some fish mortality. And warm water results in an increase in that mortality. High effort weekend tournaments result in more. Combine that with even modest release mortality and you have greater total removal then the habitat can support.
Effort density is modified by very thing we call “effort”: accessibility. On a remote, low-traffic lake, effort is distributed over the entire body of water. Fish are given recovery intervals between contact attempts. In an urban pond with several convenient entry and exit locations, the same fish are repeatedly handled. The calculator adjust for these variables. It applies modifiers to effort density. It understands that 10 anglers clustered in a tight area produce greater biological stress than 20 anglers dispersed throughout a large reservoir. Clustering transforms a sustainable fishery into a depleted one.
The flip side is recruitment. By this, I mean how many catchable fish are added to the population every year. The answer changes dramaticly depending upon water type and species. Trout depend largely on cold water refuges. Often their numbers needs to be added via stocking. Bass populations will rise and fall based off forage and spawning success. Panfish recruit in droves. But they are susceptible to harvest at very small size. Without an understanding of a water’s capacity to replenish itself, you can’t accurately assess the pressure level. High-effort water with good recruitment may be stable. Low-effort water with poor recruitment may being heading downhill.
And then it outputs a sustainability score. A replacement balance. If the balance is negative, there aren’t enough new recruits to offset number of deaths from fishing. That’s the red zone. That’s your sign that level of effort on this fishery isn’t sustainable long-term. If the balance is positive, it shows the fishery is handling current pressure. It might even be more than that. It is not necessarily abundant. It is just able to hold itself up.
Treat this like a planning screen. It is not an exact census. Biology in the real world gets messy. Simple math doesn’t account for habitat quality. Temperature plays a role. Disease plays a role. But being able to understand the ratio of recruitment to loss helps you advocate for improved management. It helps you decide when to move to circle hooks, it helps you decide where to go and find lower pressure areas. It helps you decide when to push for regulation changes that will help protect the spawning stock.
You want the bite to continue coming. In order to preserve any fishery, we have to look beyond what we catch in the moment. We have to acknowledge that each and every fish we catch is a vote on what that body of water will be made of in the years to come. And then we must measure the worth of that vote against power of the replacement class. Trouble arises when the two don’t match up well.
The best fishery management begins with an honest accounting. The best anglers understands that the most valuable catch they make isn’t the biggest one but rather the one that allows them to get back next season. The one that keeps finding the water alive.