Average Fish Size Trend Calculator
Compare two catch-log periods by average length, weight, condition, sample size, species growth pace, pressure, season, and gear consistency.
📌Catch-log presets
⚙Trend settings
Percent of fish at or above your local quality length.
Keep this benchmark the same across both periods.
Average size trend forecast
Full breakdown
📋Species and gear sampling grid
Largemouth Bass
Trout
Walleye
Panfish
Catfish
Striped Bass
Northern Pike
Redfish
📐Species trend benchmarks
| Species group | Typical good annual length gain | Quality-size share signal | Best comparison window |
|---|---|---|---|
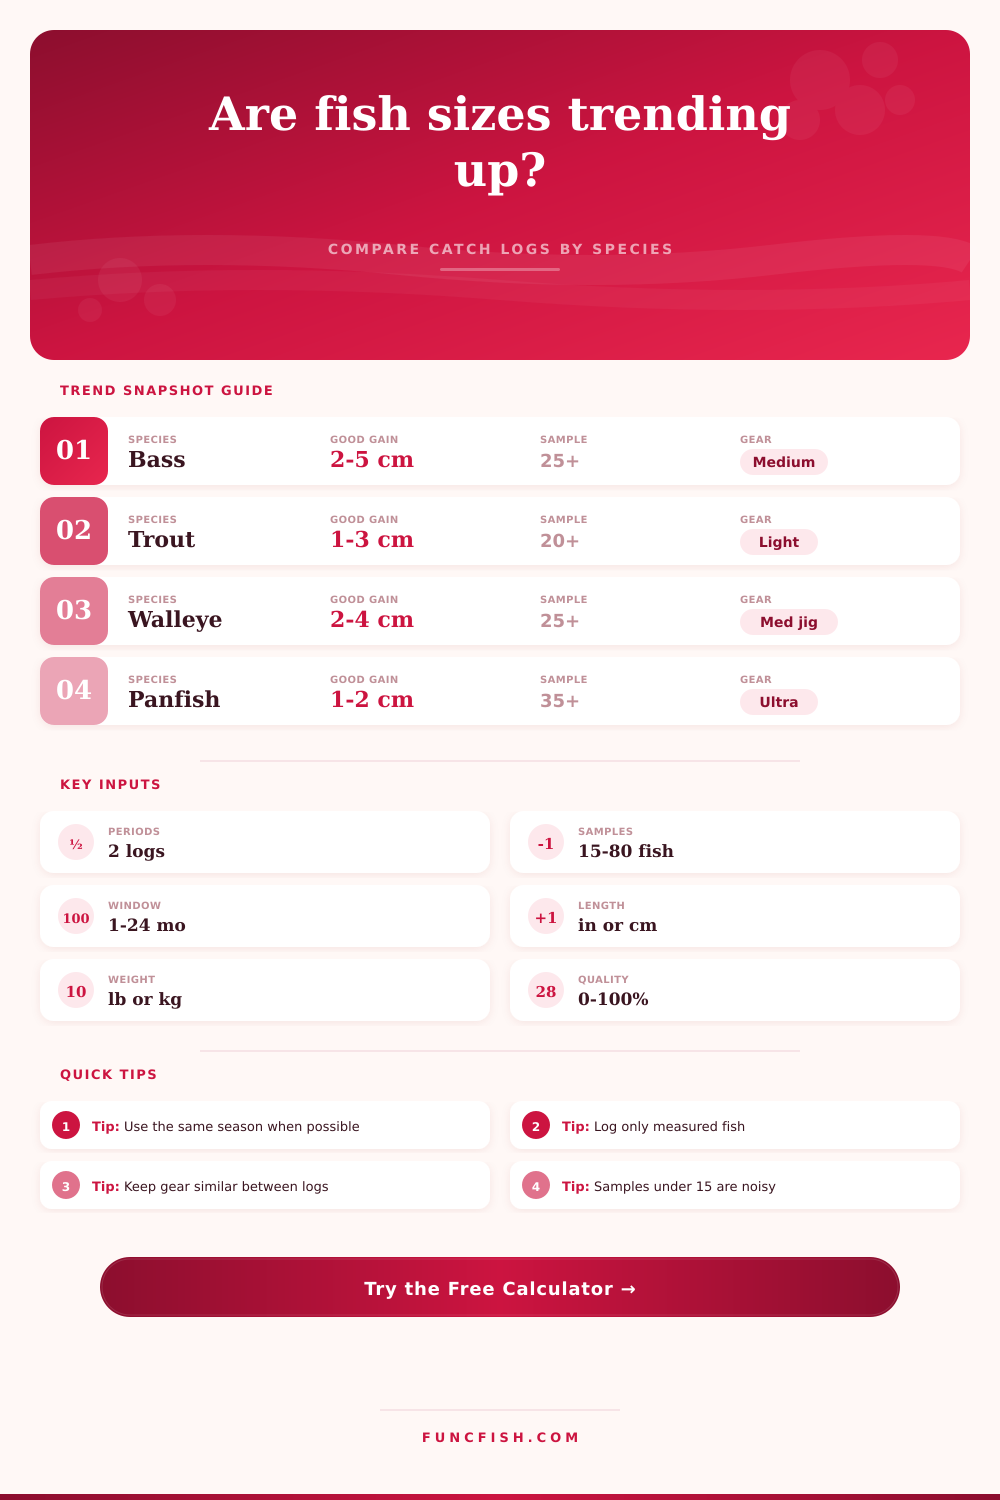
| Largemouth bass | 2-5 cm / 0.8-2.0 in | Up 8-15 points is strong | Same season, 25+ measured fish |
| Smallmouth bass | 2-4 cm / 0.8-1.6 in | Up 6-12 points is strong | Same season, similar lure size |
| Trout | 1-3 cm / 0.4-1.2 in | Up 5-10 points is useful | Same stream reach and season |
| Walleye | 2-4 cm / 0.8-1.6 in | Year-class jumps can be sharp | Same depth band and technique |
| Panfish | 1-2 cm / 0.4-0.8 in | Small losses may flag stunting | Higher sample count preferred |
| Catfish | 3-7 cm / 1.2-2.8 in | Weight shift matters more | Separate channel and flathead logs |
| Striped bass | 4-8 cm / 1.6-3.1 in | Runs can bias size quickly | Compare same run timing |
| Northern pike | 4-9 cm / 1.6-3.5 in | Large fish share is key | Use similar cover and leader gear |
| Redfish | 3-6 cm / 1.2-2.4 in | Slot share often tells the story | Compare same tide and habitat band |
| Salmon | Run dependent | Use length plus weight together | Compare same run segment |
| Carp | 2-6 cm / 0.8-2.4 in | Condition can swing by season | Same bait style and location |
📊Trend interpretation table
| Trend score | Calculator status | Likely meaning | Confidence check |
|---|---|---|---|
| 80-100 | Strong improvement | Average size, quality share, and condition line up | Best when both samples are 25+ fish |
| 62-79 | Improving | Size is rising with acceptable support from the log | Watch gear or seasonal differences |
| 45-61 | Stable or mixed | Average changed, but signal is not decisive | Collect another comparable period |
| 28-44 | Declining | Length or quality share slipped after adjustments | Check pressure and sample bias |
| 0-27 | Sharp decline | Multiple indicators moved down together | Recheck measurements and sample mix |
🔍Sampling adjustment table
| Adjustment factor | Calculator treatment | Why it matters | Best practice |
|---|---|---|---|
| Same gear | Full confidence credit | Similar lure or bait size reduces selection bias | Repeat line, hook, bait, and retrieve style |
| Mixed gear | Moderate confidence penalty | Bigger lures may select bigger fish | Keep a note on gear changes in the log |
| Same season | No seasonal penalty | Growth, migration, and spawn timing affect size | Compare spring to spring when possible |
| Different season | Larger confidence penalty | Fish condition and location can shift quickly | Use a longer rolling average |
| Low sample count | Lower confidence score | A few unusually large fish can move the mean | Use at least 15 fish, ideally 25+ |
| High pressure | Trend score reduced | Harvest pressure can remove larger fish first | Separate high-use areas from low-use areas |
💡Practical checks
Tip: Use the same measuring method for both periods. A bump board, fork length, total length, or estimated length should not be mixed inside one trend.
Tip: If the confidence score is low, treat the trend as a screening signal and compare one more matching catch-log window before drawing conclusions.
By contrasting two different time frames within your catch logs, the calculator lets you swap out fuzzy recollections for hard data. Do you think the fish have gotten smaller? Don’t trust your memory: it’s a lousy statistician. We tend to recall big catches we caught a few years back while convenientley forgetting about all those little fish we threw back. The calculator eliminates emotion and gets down to brass tacks, separating a poor day of fishing from an actual downturn in stock health.
That’s why it’s so critical to start with a good baseline. A clear picture of where things were before. You also need a clear picture of where thing are now. That means a consistent measurement of weight and length. Don’t measure fork length on one log, then total length on another. Trend data doesn’t work if you don’t does that. Why? Because an extra inch or two make a big difference in weight and ability to breed. So when the tool requests details, that’s why.
Why You Should Track Your Fishing Data
How much did your largemouth bass grow? Two to five centimeters annually is solid growth. Half as much, perhaps there’s something off. Double, maybe you’re in a boom year. Having the benchmark lets you know what matters different than what doesn’t.
What most anglers fail to realize is that this is all about sample size. One large fish does not make a trend. That’s an outlier. The calculator takes small sample sizes into account because without the law of large numbers coming into play, there’s no way to rely on average. So if you measured only forty fish in the first period and then only fifteen in the next period, there’s simply too much variance to get any idea what is happening. Ideally you’ll have at least twenty-five fish per period so you’re feeling good about things. And yes, this is all very tedious writing things down as you go along but man it pays off once you start seeing the pattern develop.
This isn’t about catching fish, it’s about keeping track of the health of ecosystem. Gear is another factor that is easy to ignore but cannot be dismissed. Using big swimbaits and small jig heads will draw larger fish into your log, creating a false positive trend. For this reason, the tool asks whether you used consistent gear. Did you change things up? Confidence score goes down. Data is now contaminated. It is best to stick with the same method, even if it is more boring, as this keeps the factors controlled. Remember, you’re measuring the water here, not your tackle box.
The second factor affecting fish size is season. In general, winter slows down the growth of fish while summer accelerates it. So if you compare a fall record against a spring record, there is almost certainly going to be an upward trend. But again that’s biologically based. Doesn’t mean they’re managed well, doesn’t mean they’re managed poorly. This calculator adjusts for seasonal matches and the number of months between your two logs. That way it can even out the data and you’ll be able to see what’s actualy happening.
If there’s a strong improvement score, that means the fish are truly becoming larger/heavier. They are not just fatter for the winter. That’s the distinction between a trend and a fluke.
Another factor is pressure management. High harvest pressure typically removes the largest fish out of a waterway. That skews the average lower. The tool accounts for the level of pressure it observes. It knows that if most of the fish are caught versus those released, that could cause average size to go down. It points to the connection between angler behavior and the population structure. The blame can’t be put on the water when the issue stems from a tackle on the bank. It’s all part of being a good steward.
Tracking things is a long conversation with the water. A casual thing becomes something more. You begin to notice both small changes over time as well as big-picture things happening environmentally, even from your personal choices. The numbers don’t lie. If you’re doing it right, you would of known for sure instead of guessing what is going on. It could be as simple as figuring out your home waters or learning how to manage a local pond.