Catch and Keep Sustainability Calculator
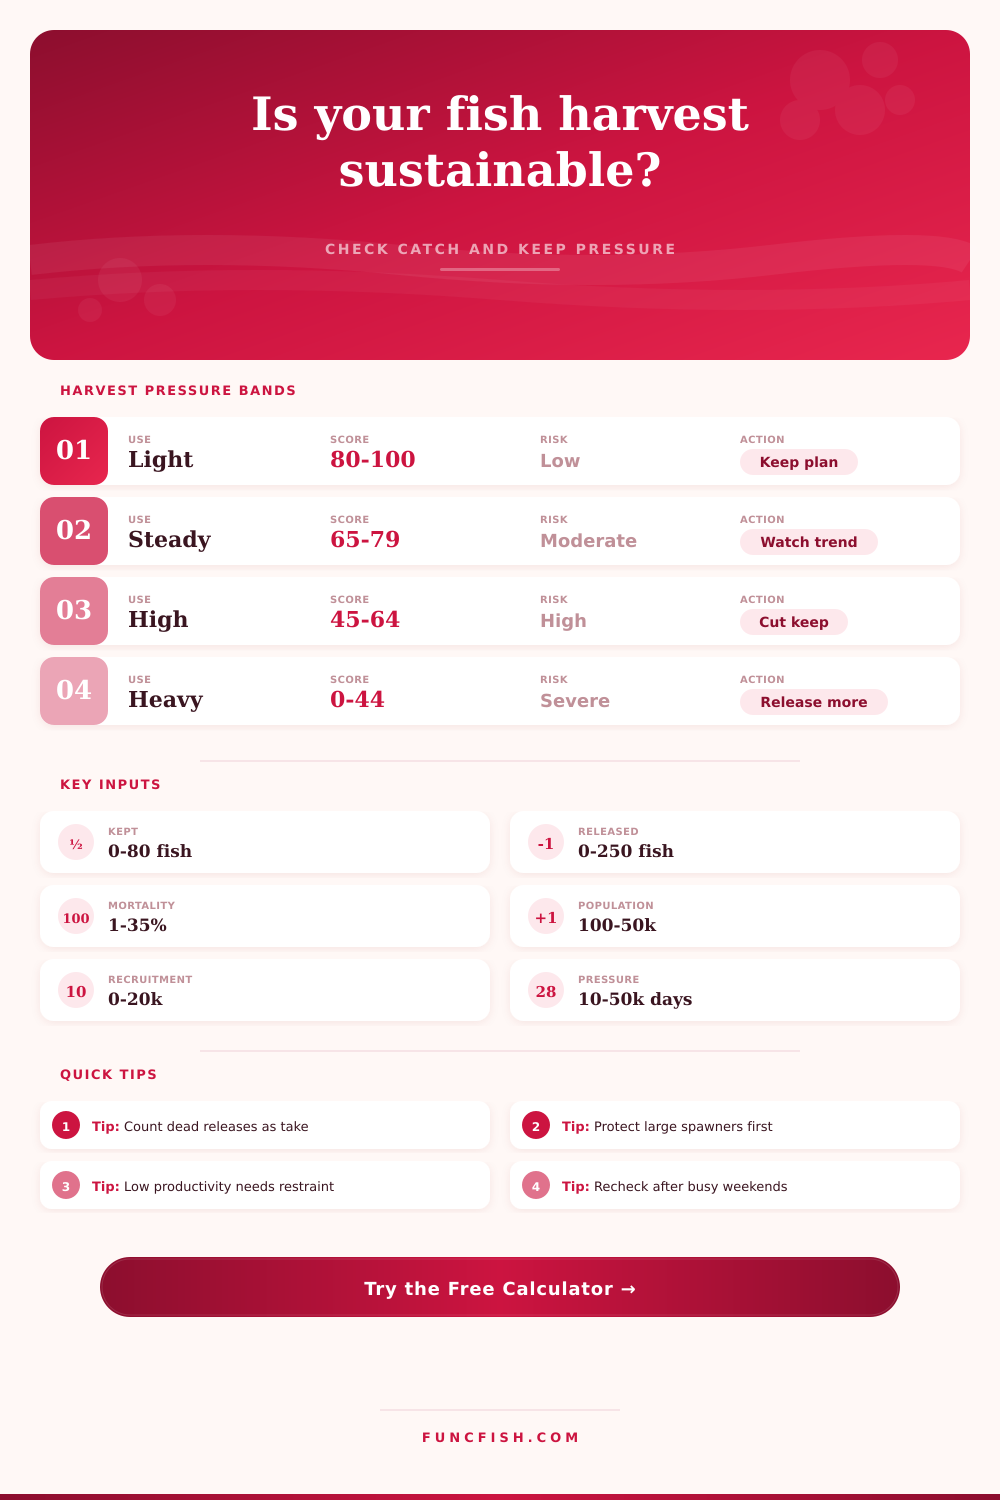
Estimate whether a catch-and-keep trip fits the fishery by combining kept fish, release mortality, adult population, annual recruitment, angler days, size class, and lake productivity.
📌Harvest scenario presets
⚙Trip and fishery inputs
This calculator is a planning tool. Use local creel surveys, agency stock assessments, and actual regulations when those are available.
Catch-and-keep sustainability forecast
Full breakdown
📋Species and harvest grid
Bass Slot
Walleye Meal
Panfish
Musky
📊Reference tables
| Species group | Base annual harvest rate | Release mortality range | Recruitment reliance |
|---|---|---|---|
| Bass | 12-20% of adults | 3-12% | Moderate |
| Walleye | 14-24% of adults | 4-15% | High |
| Trout | 20-35% of adults | 5-18% | Stocking sensitive |
| Panfish | 20-35% of adults | 2-8% | High annual turnover |
| Pike | 10-18% of adults | 4-12% | Large fish sensitive |
| Musky | 3-8% of adults | 2-10% | Low density |
| Lake productivity | Harvest capacity factor | Recruitment credit | Planning note |
|---|---|---|---|
| Low productivity | 0.65x | 35% | Slow replacement and cautious harvest |
| Moderate productivity | 1.00x | 45% | Average food web support |
| High productivity | 1.25x | 55% | Better growth and replacement |
| Very fertile | 1.45x | 60% | Higher yield if habitat stays stable |
| Stocked / supplemented | 1.55x | 70% | Depends on stocking consistency |
| Size class kept | Spawner penalty | Biomass multiplier | Preferred keep pattern |
|---|---|---|---|
| Sublegal / juvenile | High compliance risk | 0.5x | Do not keep where prohibited |
| Small legal | Low | 0.8x | Often best for meals |
| Protected slot edge | Moderate | 1.0x | Check slot carefully |
| Prime adult | Moderate-high | 1.2x | Limit repeated harvest |
| Large spawner | High | 1.7x | Release when possible |
| Trophy class | Very high | 2.4x | Release except special harvest |
| Annual removal load | Status | Score effect | Harvest response |
|---|---|---|---|
| Under 50% of capacity | Light | Positive | Keep within plan |
| 50-80% of capacity | Steady | Watch | Track year class |
| 80-110% of capacity | Tight | Penalty | Reduce large fish keep |
| Over 110% of capacity | Overdrawn | Heavy penalty | Shift to release or smaller meals |
💡Calculation tips
Tip: Release mortality belongs in the harvest count. A trip with many deep-hooked or heat-stressed releases can remove more fish than the cooler shows.
Tip: If the score falls because of size class, keep smaller legal fish for meals and leave prime spawners to support the next year class.
The stillness of the boat and a full cooler leaves you feeling pretty good; however, what lies beneath that sense of satisfaction is an economic principle most anglers fail to recognize, until the bite gets tough. It’s simply this: There’s only so much room for food, there’s only so many eggs, and there’s only so many fish in a system before you start extracting more than the lake can provide. And when that happens, those numbers dwindle. The fish diminish and they goes away. There is nothing magical about it, just plain old math involving populations that sometimes seems like recreation itself. To think sustainabley, you have to look beyond that bucket in front of you and consider water you’re in.
Once you input your trip information, this calculator does the math for you. You won’t have to guess if your catch is sustainable based off biology of the lake. By using both hard data (population estimates) and soft variables (release mortality), it produces a sustainability score.
Why You Should Care About Fish Sustainability
This isn’t law; it’s a mirror. It is a mirror of whether amount of fish your group caught represents taking the surplus or eating into the future supply. The lower the number, the more likely it is that you ate into the future supply instead of harvesting the surplus.
The other factor included in the score but which diminishes it at an accelerated rate: release mortality. For every five you retain, you may have released 20, and three of those died either deep hooked or exposed to air for too long. In reality, you only took home eight. Yet when you tally your catch with the tool, those deaths are factored in because fishery lost the fish, regardless of where they met their end; on the water or in the net.
Stress kills, yet anglers believe they’re doing nothing wrong when they release fish. If they swam off weak today, they won’t be spawning tomorrow. That’s the part humans miss. They count the keepers and forget the casualties. They got away,” so everything must be fine.
And then there’s size. A small legal fish has not produced much so far but will take away from a future spawner and hungry mouth. A large fish is a genetic powerhouse capable of producing thousands of eggs that will be lost if kept. The tool lays that out very well in its reference tables. A large spawner has disproportionate value for the next generation and carries a heavy multiplier for biomass. So protecting those fish isn’t an act of mercy but one of stock stability.
When you keep only the big ones, you’re thinning the forest of your fishery and allowing saplings to grow slow and sparse. Pressure isn’t everything. Just as important is productivity. Clear, nutrient-poor lakes runs on a shoestring budget. Their food chain has a thin bottom and every fish count. Harvesting too many fish will send those numbers plummeting.
Fertile, weedy lakes have an abundance of both cover and food. They can bear a heavier harvest. The calculator includes this through harvest capacity factors. If a lake has trouble growing fish then it doesn’t support the same number of angler days as one with minnows and crayfish bursting out its ears. Neglect that fact and you’ll find your waters empty, like a ghost town of what they used to be.
The wild card is recruitment. An overfished population might be saved for a season or two by a strong year class, and revealed immediately by a poor one. The pressure you put on it is something you can control. The weather, and the spawning success, aren’t. If there’s a poor recruitment signal, then cutting back on keeps is a smart move, even if regulations permit limits.
Being a tourist means waiting until after a crisis to change your habits. Locals don’t have that luxury. You can have fish and eat them too. You just need to do so in a way that lasts.
Before you go, take that tool and run through your plan and see how it checks out. If it sends your score into the high risk category, then you’ll know to back off on size or release some more. Each time you pull the boat up to the bank, the water will remember. Make certain you’re putting money in the balance sheet and not draining the account. Next summer, you want the fish to still be there. You’ll be fighting hard and waiting to fill your cooler again.