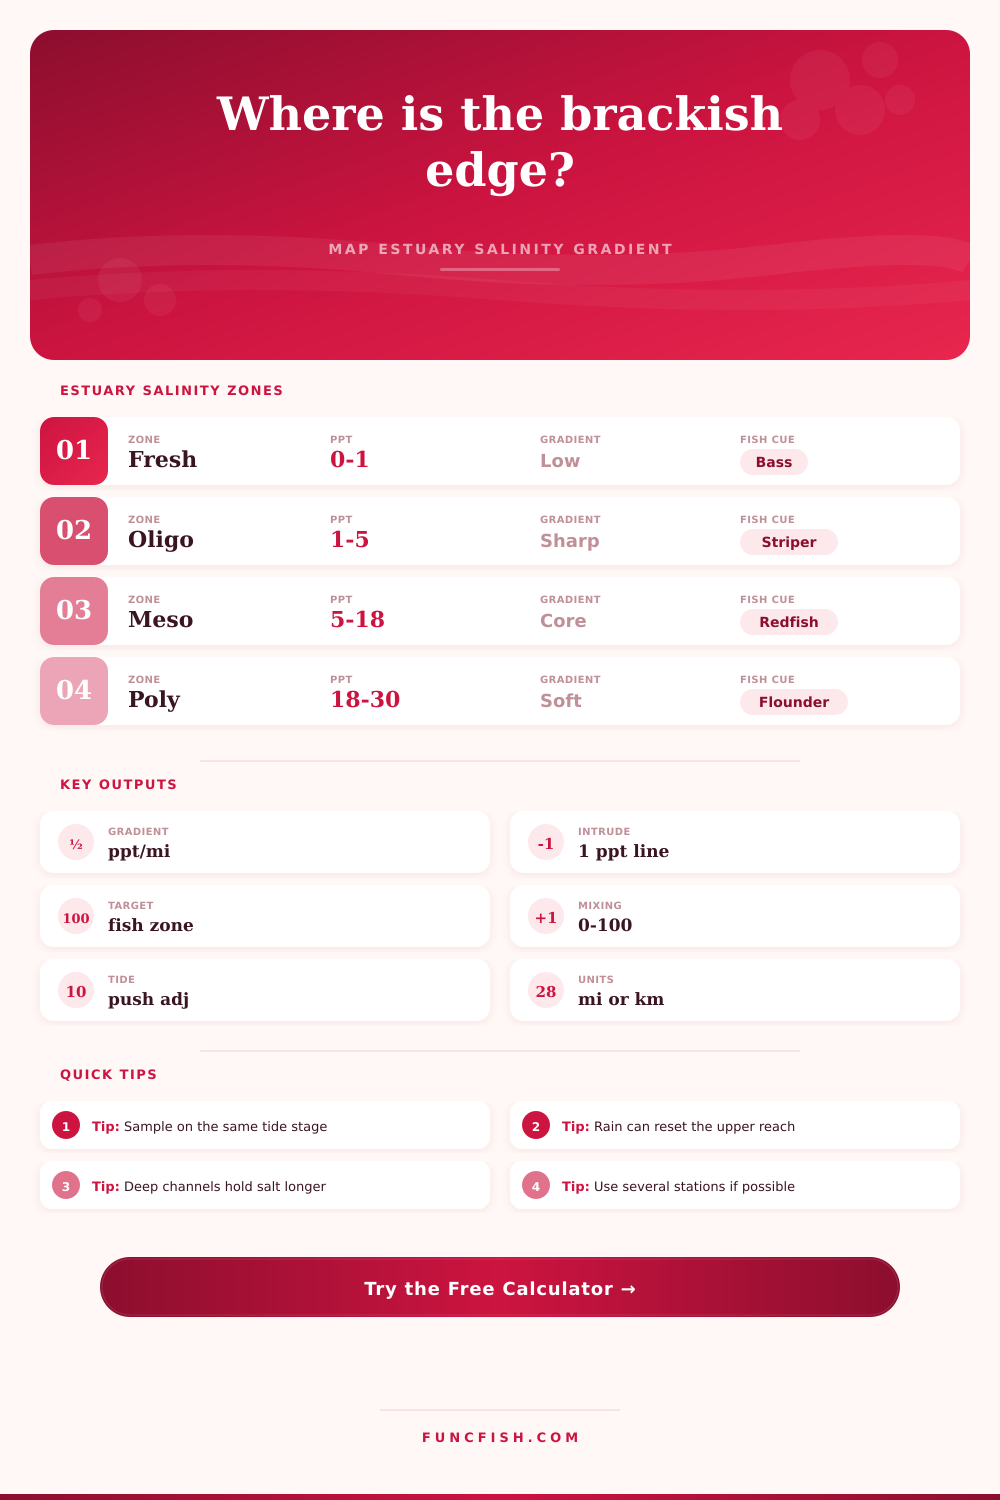
Estuary Salinity Gradient Calculator
Estimate salinity change from the mouth upstream, locate brackish fishing zones, and judge salt wedge strength from tide, river flow, depth, and mixing conditions.
📌Scenario presets
⚙Gradient settings
Estuary gradient forecast
Full breakdown
📋Salinity zone reference grid
Tidal Fresh
Low Brackish
Mid Brackish
Coastal Mix
📐Reference tables
| Target fish or habitat | Useful salinity band | Optimum planning point | Gradient cue |
|---|---|---|---|
| Striped bass | 1-18 ppt | 8 ppt edge | Often patrols the sharp fresh-to-brackish line |
| Redfish / red drum | 5-35 ppt | 18 ppt flats | Comfortable through broad brackish water |
| Flounder | 10-35 ppt | 24 ppt channel lip | Favors salty inlet and bay-bottom lanes |
| Weakfish / sea trout | 12-30 ppt | 20 ppt bay mix | Looks for bait where the gradient softens |
| Snook | 3-32 ppt | 15 ppt mangrove edge | Uses warm brackish creeks and passes |
| Tarpon | 5-36 ppt | 22 ppt pass | Tracks bait during flood-tide salt push |
| Oyster reef edge | 10-28 ppt | 15 ppt reef water | Persistent middle salinity is the useful cue |
| Juvenile baitfish | 2-18 ppt | 7 ppt nursery | Upper estuary protection zone |
| Tidal largemouth | 0-5 ppt | 2 ppt upper reach | Fresh side of the salt line is usually safer |
| Estuary setting | Salt reach factor | Vertical wedge tendency | Field interpretation |
|---|---|---|---|
| Salt wedge river mouth | 1.20 | High | Bottom water can stay salty well upstream |
| Partially mixed bay | 1.00 | Medium | Surface and bottom readings both matter |
| Well mixed tidal creek | 0.82 | Low | Single mid-depth readings are more useful |
| Deep fjord channel | 1.34 | Very high | Deep salt layer can lag behind runoff changes |
| Wind mixed lagoon | 0.74 | Low | Wind often smears the horizontal gradient |
| Inlet pass / barrier cut | 1.10 | Medium | Tide phase can move the line quickly |
| Delta distributary arm | 0.92 | Medium | River flow controls the upper salt edge |
| Tide or weather signal | Expected salinity move | Best sampling choice | Fishing read |
|---|---|---|---|
| Strong flood | Salt line moves upstream | Check mouths, points, and creek bends | Bait may ride into upper pockets |
| Strong ebb | Fresh water pushes seaward | Check drains and channel mouths | Predators hold below the fresh plume |
| Spring tide | Greater exchange and range | Compare low and high slack readings | Edges move farther in one tide cycle |
| Neap tide | Weaker salt movement | Use repeated stations on the same tide | Stable zones can hold longer |
| After heavy rain | Upper estuary freshens | Sample from the mouth upstream | Fish may slide toward the middle reach |
| Drought flow | Salt reaches farther upstream | Watch shallow creeks and drains | Freshwater species retreat upriver |
| Example station pair | Mouth to upper reading | Gradient | Likely target line |
|---|---|---|---|
| Small tidal creek | 22 to 8 ppt over 6 mi | 2.3 ppt/mi | 15 ppt near 3 mi |
| Spring river mouth | 18 to 1 ppt over 22 mi | 0.8 ppt/mi | 5 ppt near 17 mi |
| Inlet bay channel | 31 to 18 ppt over 9 mi | 1.4 ppt/mi | 24 ppt near 5 mi |
| Rain fresh pulse | 14 to 0.5 ppt over 12 mi | 1.1 ppt/mi | 8 ppt near 5 mi |
| Drought salt push | 34 to 12 ppt over 28 mi | 0.8 ppt/mi | 18 ppt near 20 mi |
💡Practical checks
Tip: Pair each salinity reading with tide stage and depth. A surface sample on a hard ebb can miss a salty bottom layer that still positions bait and game fish.
Tip: Treat the target distance as a reach, not a single waypoint. Wind, runoff, and boat wake can shift the fishable edge across nearby bends and channel lips.
It’s a biological line in a sand, a place where fresh water collides with saltwater. That collision form a gradient that governs everything from baitfish positioning to the availability of oxygen. The line is dynamic; it ebbs and flows according to rainfall, wind direction and tidal movements. It’s also the line most fishermen mark on their mapping software and then fish right past without knowing they’ve crossed over.
Knowing where the line exists will help you fish for predator rather than casting to open water. Density controls the physics of the mixing zone. Freshwater float on top of saltwater. And since saltwater is denser than fresh, it slides underneath the fresh top layer. In slow-moving rivers with little flow, or even on deep channel, you can get a long stretch of saltwater that extends for miles upriver under a fresh surface mix. You could be fishing over a shallow flat where you have clear water and baitfish don’t know there’s a dense layer of salt beneath the bottom structure.
Finding the Salt Water Line
To better visualize this, the calculator adjust for tidal range, flow and depth. It knows how different deep channels hold salt versus a wind mixed lagoon. It give a mixing index that lets you know if you should expect an abrupt change from fresh to salt, or a more gradual blending throughout. Why? Because it will determine where the food concentrates, which determines what type of lure you’ll want to throw.
The other variable in this mix are river discharge. In hours, a major rain event up-river can shove the entire salinity gradient downriver by several miles. Or a prolonged drought pull the salt back up into the rivers. There, what was once a nursery in fresh water become an eating area in brackish water. The model takes these dynamics into account and modifies the amount of intrusion based off river flow and tidal state when you enter that info. For example, neap tides don’t move the water as much as spring tides do. Because of this, they pull the salt line further upstream at flood stage. This information will help you plan your trip timing.
Is the tide still coming in strong? Then the edge of the salt is coming in, and the same happens as it goes out, the fresher water flushes in the opposite direction. The reference tables gives you a quick lookup of their preference for species. Redfish tend to be more tolerant of wider brackish areas, but the striped bass will often cruise along that hard line of transition.
Finally, note that the gradient extend vertically as well. Two parts per thousand on a hand-held refractometer read while standing on a dock may look like freshwater. But maybe you’re in a sluggish river with deeper water. Maybe the bottom water are twenty parts per thousand. That is the difference, and that is where things happen. The calculator’s output is salt intrusion line, which shows where the concentration reaches one part per thousand. If there’s likely to be vertical stratification, the mixing index tell you so. Where the mixing value is high, the water column is well-stirred; take your surface read as being true for the entire depth. Where the mixing value is low, look for fish holding to the bottom, or target certain depth zone.
There’s no exact coordinate; fishing the gradient is about understanding where the energy flows. Where the bait goes (following the current and its associated food sources), that’s where the predators go. As the tide turns, the gradient moves with the changing pressure. Local knowledge matter, a warm front can alter density layers and a sudden wind shift can smear an otherwise sharp gradient all over a broad bay. Think of the calculator as providing a baseline prediction using standard hydrological models. Then use your eyes to locate movement on the surface or look for a break in the water color. You’ll often see the salt line moving, and knowing which way it heads will be important.
So what do you do? You’re trying to be there at the right time. If you keep tabs on the rising and falling salinity levels from upriver down toward the mouth, you can anticipate where the best feeding area will form. Are they mangrove creek snook? Do flounder inhabit the inlet channel? It’s all relative. The water flows, the salt travels, and the fish take advantage of it. Figuring out that gradient becomes an exercise in turning a random search mission into a well-thought-out plan. No more guesswork…now you fish on purpose.
The scent of river giving way to salt is a promise that tells you exactly where to look. You should of seen it.