Fish Bone Content Estimator
Estimate total bone mass, recoverable frame weight, retained pin-bone load, and edible yield from species group, fish size, processing form, cut style, and trimming precision.
📌Bone content presets
⚙Fish and cut inputs
Use this as a batch planning estimator. Actual bone percentage changes with species, age, sex, season, head retention, and cutting style, so weigh a sample frame when precision matters.
Bone content estimate
Whole-batch skeleton estimate.
Adjusted by species, size, and cut.
After bone, form, trim, and moisture allowance.
Pin, rib, or steak bone likely left in final portions.
Calculation breakdown
🐟Species bone profile grid
Bass Form
Trout Form
Salmon Form
Pike Form
📊Reference tables
| Species group | Baseline bone | Head share | Pin-bone share | Planning note |
|---|---|---|---|---|
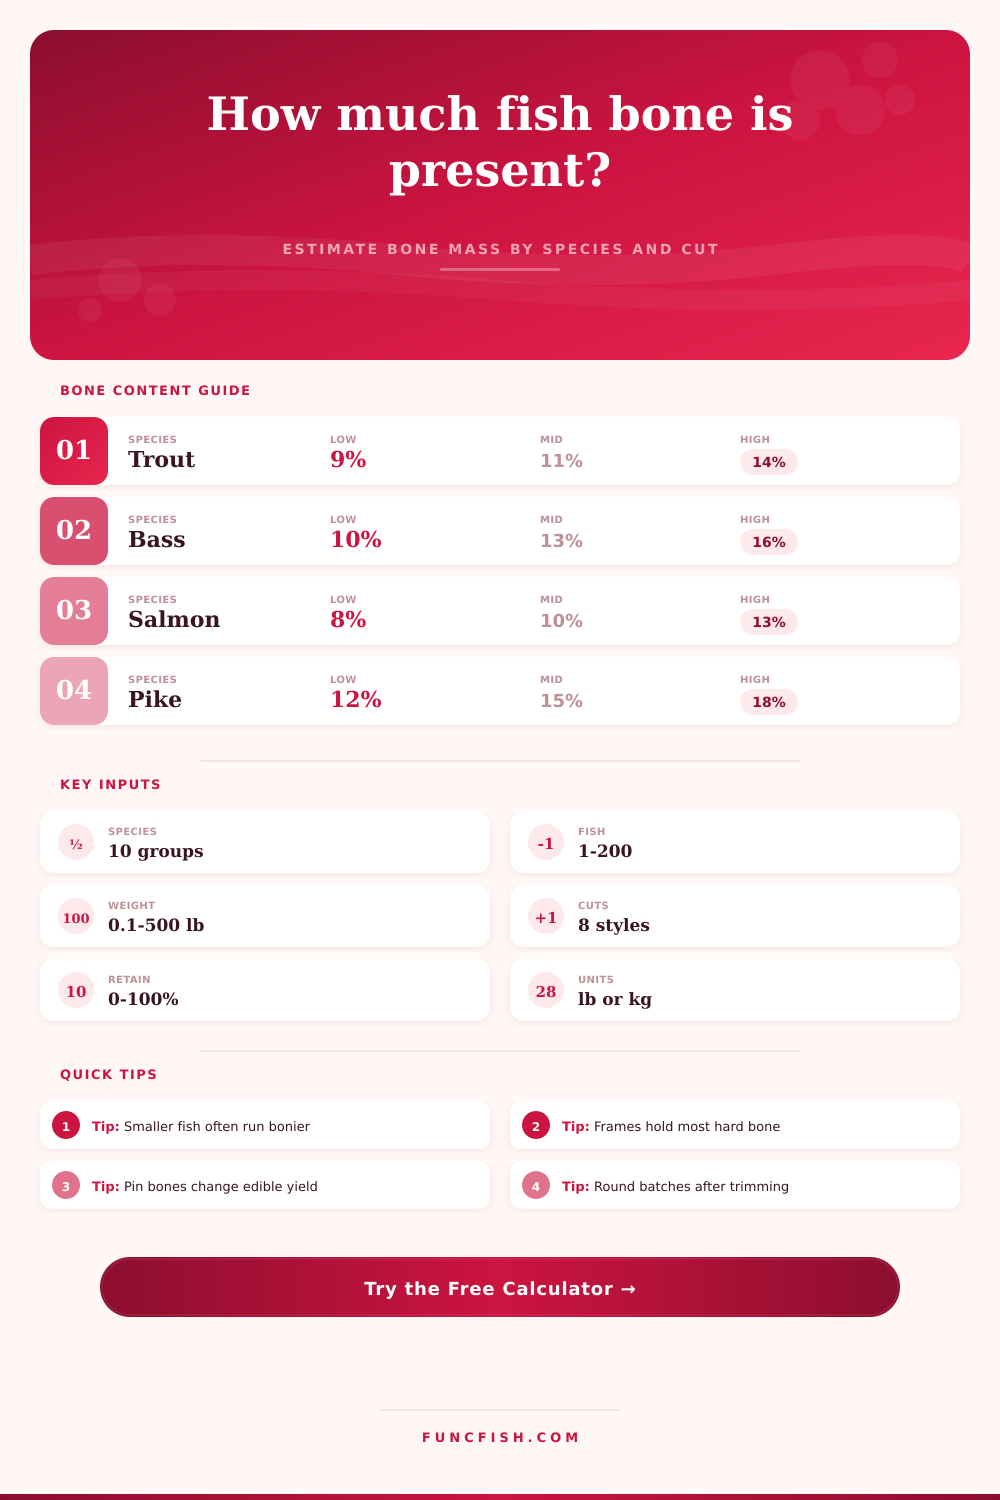
| Bass / perch-like | 13% of round weight | 18% of bone mass | 7% of bone mass | Moderate ribs, simple fillet planning |
| Trout / char | 11% of round weight | 15% of bone mass | 12% of bone mass | Fine ribs and pin bones matter in small fish |
| Salmon | 10% of round weight | 14% of bone mass | 15% of bone mass | Large spine, clear pin-bone lane |
| Walleye / zander | 12% of round weight | 17% of bone mass | 9% of bone mass | Firm rib cage and clean fillet line |
| Catfish | 14% of round weight | 20% of bone mass | 5% of bone mass | Heavy head and pectoral structure |
| Snapper / reef fish | 16% of round weight | 22% of bone mass | 8% of bone mass | Strong head and rib cage |
| Pike / muskie | 15% of round weight | 17% of bone mass | 18% of bone mass | Y-bone trimming changes final yield |
| Panfish | 14% of round weight | 16% of bone mass | 8% of bone mass | Small fish tend to show higher bone percentage |
| Tuna / pelagic | 8% of round weight | 12% of bone mass | 3% of bone mass | Loin recovery leaves less fine bone |
| Halibut / flatfish | 9% of round weight | 13% of bone mass | 4% of bone mass | Flat frames have high usable fillet surface |
| Processing form | Bone visible in source | Typical edible yield | Calculator adjustment | Best use |
|---|---|---|---|---|
| Whole round fish | All skeletal zones | 35-65% | Full bone mass included | Catch box or cooler planning |
| Gutted, head on | Head, spine, ribs, pins | 42-70% | Viscera already removed | Shore station batches |
| Headed and gutted | Spine, ribs, pins | 48-72% | Head bone removed from source | Market-style dressed fish |
| Skin-on fillets | Ribs or pins may remain | 82-94% | Frame already removed | Portion trimming estimate |
| Skinless fillets | Pin bones or rib strip only | 88-97% | Low source bone factor | Boneless yield planning |
| Steaks | Center spine in each cut | 78-90% | Retains cross-section bone | Large fish steak cutting |
| Loin sections | Minimal hard bone | 92-98% | Mostly pin and trim check | Tuna or pelagic prep |
| Trimmed portions | Very low residual bone | 94-99% | Residual retained bone only | Final serving audit |
| Cut style | Bone removed | Retained bone risk | Yield effect | When to select |
|---|---|---|---|---|
| Whole or bone-in | None before serving | High | Highest retained bone | Whole fish or bone-in steaks |
| Standard fillet | Frame and spine | Medium | Balanced yield | Most freshwater fillets |
| Deep V-cut | Pin-bone lane | Low | Extra trim loss | Salmon, trout, larger fillets |
| Ribs removed | Rib cage | Low-medium | Moderate trim loss | Boneless fillet target |
| Steak cut | Head and gut only | High center bone | Good portion stability | Large fish cross-cuts |
| Loin trim | Frame, ribs, skin line | Very low | High trim precision | Pelagic loin sections |
| Y-bone trim | Y-bone strip | Low after trim | Large trim penalty | Pike and muskie planning |
| Mince recovery | Hard frame separated | Very low | Adds frame recovery | Frame scraping or mechanical recovery |
| Batch size | Sampling method | Suggested buffer | Confidence band | Reason |
|---|---|---|---|---|
| 1-3 fish | Weigh each frame | 15-25% | Wide | One fish can skew the batch |
| 4-12 fish | Weigh largest and smallest | 10-18% | Moderate | Size spread still matters |
| 13-40 fish | Weigh a 10% sample | 7-12% | Good | Averages stabilize quickly |
| 41+ fish | Weigh class samples | 5-10% | Strong | Separate small and large fish |
| Mixed species | Split by body form | 12-20% | Variable | Bone structure differs sharply |
💡Bone estimating tips
Sample the frame: For the best batch estimate, weigh one cleaned frame from the same species and size class, then compare it with the calculator output.
Separate cut styles: Do not average steaks, fillets, and loin cuts together. Run separate estimates, then add the totals for a cleaner batch number.
When you think of catching a trout, you expect some flaky white meat; instead, half of what you eat for dinner looks like skeleton. Where do most fishermen go astray? It is between the whole fish and the fish that’s fit to eat. Fillet and gutting isn’t all there is to it. Knowing exactly what percentage of the fish are left behind as scraps in the frame is key.
Plug in your cut style and species into this calculator. It will spit out the answer in terms of pounds and save you from having to guess if that six-pound bass is going to become a pound of scraps or steak.
How to Calculate Edible Fish Yield
First of all, different kinds of fish has different skeletons. Consider the difference between a trout and a pike: the trout has a finer, lighter framework; the pike have a heavier bone structure with more dense ribs. By selecting the species in the tool, what you’re doing is establishing a starting point for how much bone there is. Why? Because regardless of your knife skill level, you’ll find that a ten pound pike will leave far more waste on the cutting board then a ten pound trout. The page shows the baseline bone share for each grouping in the reference table. The takeaway is this: Don’t think all freshwater fish are interchangeable.
Then there’s size. Because larger fish has a higher percentage of flesh compared to their bones, they’re typically less likely to be boned out. This means that when you process a bucket of small panfish, your yield will decrease quicker then it would with a few large trophy. To account for this, the tool allow you to enter in an average length and weight so it can apply a size class adjustment. It’s just one of those little details which keeps you from wildly overestimating your yield.
Finally, there is the cut. And here’s where the confusion lie for most folks. Most folks leave the head and spine intact as they create a standard fillet, leaving the rib cage and pin bones right in into the meat. Switching over to a rib-out fillet or a deep V-cut will decrease your yield, but provide a cleaner piece of fish. That means reducing the edible yield downward on the calculator to account for that lost meat as you clean out those pesky ribs. Is it worth having a bigger piece to deal with at meal time? Or should you go for a slightly smaller piece of cleaner fish with a bit less meat?
Another variable that seems somewhat subjective until you quantify it is trimming precision. If I make a rough field cut, there will be more bone in the meat and maybe some extra meat on the bone. If I make a clean, practiced cut, I can maximize my recovery but need a sharp knife and steady hands. This allows you to choose your skill level with the tool, changing how much blood line and moisture you’ll allow yourself to trim off of the fish. It’s a nod to the fact that reality gets messy. When you bleed the fish, you lose weight. When you trim out dark meat, you lose weight. When you inevitably slip one millimeter too far on a fillet, it all adds up and results in loss of weight.
Pin bones are the quiet villain in any estimate. Little buggers that aren’t always factored into quick guesses but they can realy add up if you’re trying to get a boneless cut. You’ll have fewer bones if you try to pull every last one out, or you can leave a few here and there. So when you set your retained pin bone on the estimator, it adjust based off what you expect to do with those little bastards. If you’re pulling all of them (zero), then you’ll lose a bit more meat and it will take more time. If you’re leaving a few stragglers, crank it up.
In short, when you’re estimating bone content, you’re planning for reality. Knowing how much actual food you’re taking home will help you freeze it appropriately, cook it sufficiently, or equally divide it amongst friends. Don’t guess at what you caught; don’t base it off its weight alone. Think about what kind of species you have. Consider what cut you’re going to get. Follow the numbers with realistic expectations. The skeleton’s a part of the fish, but it shouldn’t of be a part of your meal.