Fish Community Balance Calculator
Score a fish survey from predator, forage, panfish, rough fish, invasive share, richness, evenness, habitat quality, and recruitment strength.
📌Community survey presets
⚙Survey inputs
Community balance forecast
Full breakdown
📋Species and community grid
Top Predators
Forage Prey
Panfish Guild
Stress Guild
📊Reference tables
| Balance band | Score range | Community meaning | Main check |
|---|---|---|---|
| Stable | 80-100 | Guilds and habitat align | Keep trend monitoring |
| Functional | 65-79 | Mostly balanced with one concern | Watch weak guilds |
| Unsettled | 50-64 | Multiple structure flags | Compare age classes |
| Shifted | 0-49 | Community likely dominated by stressors | Inspect habitat first |
| Water body | Richness target | Predator window | Forage window |
|---|---|---|---|
| Pond / small impoundment | 6-12 species | 28-42% | 30-50% |
| Natural lake | 10-20 species | 24-38% | 35-58% |
| Reservoir | 12-22 species | 26-40% | 34-55% |
| River / floodplain | 16-32 species | 18-34% | 32-55% |
| Coldwater stream | 6-16 species | 20-36% | 30-52% |
| Brackish bay / estuary | 14-30 species | 18-35% | 35-60% |
| Pressure input | Low flag | Moderate flag | High flag |
|---|---|---|---|
| Rough fish share | 0-8% | 9-18% | 19% or more |
| Invasive share | 0-5% | 6-15% | 16% or more |
| Panfish share | 10-28% | 29-38% | 39% or more |
| Forage shortage | 35% or more | 25-34% | Below 25% |
| Recruitment class | Score factor | What it implies | Trend clue |
|---|---|---|---|
| Failed year class | 30 | Young fish missing | Age gap risk |
| Weak | 50 | Limited replacement | Look for habitat bottleneck |
| Moderate | 72 | Some young fish present | Track survival |
| Strong | 88 | Good replacement | Supports resilience |
| Very strong pulse | 78 | Large year class may crowd | Watch growth rates |
💡Survey checks
Tip: Compare surveys collected with the same method and season. Switching from shoreline electrofishing to net sets can shift predator, panfish, and forage shares.
Tip: Treat a high score as a screening result, not a stocking prescription. Confirm age structure, size distribution, and habitat limits before acting.
You want bass that grows. Not just survive. You want forage that feeds them. They should not takes over the food web. And you want a perfectly balanced pond, meaning a system free from chaos. For most folks, that’s a healthy fishery with a nice predator/prey ratio. But it’s realy about recruitment, species diversity and habitat quality.
The calculator above do all this math for you (no guessing at coefficients required). After you plug in your survey data. It will turn your raw catch counts into quick look, telling you if your system is under stress, settled or unsettled.
How to Check Your Pond Health
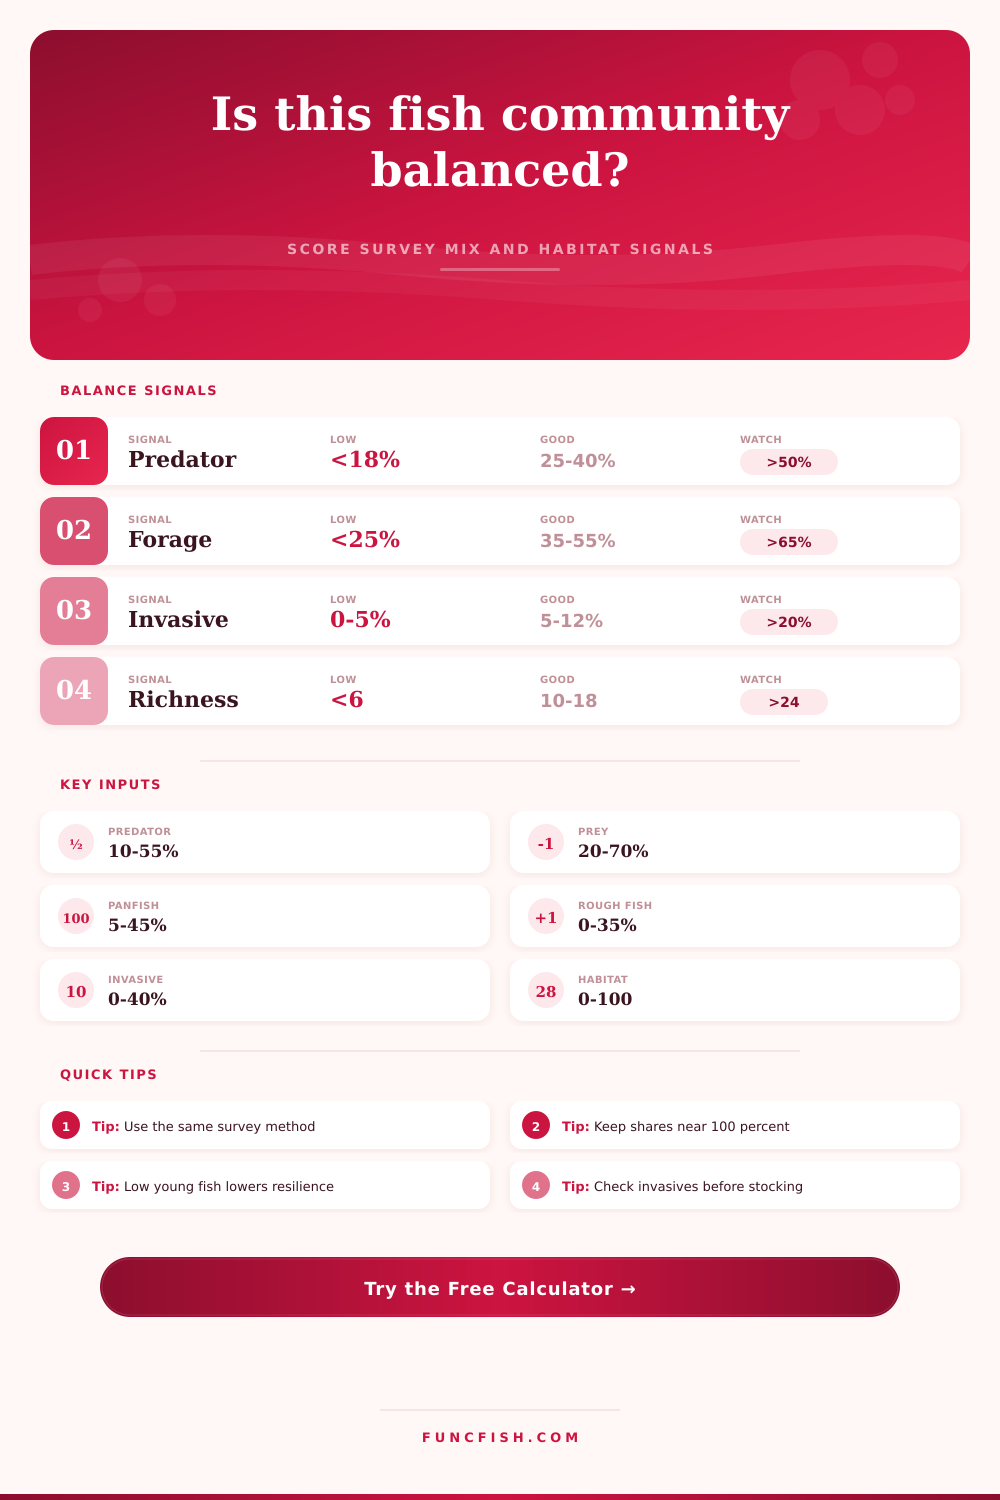
“Start with the predator-prey dynamic,” he said. Is there too little or too much food? If you survey and see too many predators on that graph, the fish won’t be growing well because they aren’t finding enough to eat. They’ll look skinny. Too much forage causes the predators to lay back down and the whole biomass is difficult to manage. This isn’t about nailing an exact number. We’re trying to balance those two shares with each other until we land somewhere in middle.”
You plug in your percentages of shad, shiners, bass and walleye and the system tells you if one share is dominating another.
Fewer anglers understands that diversity is important. If a lake has three species and one goes away, it’s hanging by a thread and all bets are off. That’s why calculator assigns an evenness score as well as richness score. Richness indicates diversity (the number of unique species), while evenness measures how evenly the community is distributed; does one species dominate? You want a mixed bag, and the reference tables on the page illustrate what should of be considered “normal” in terms of species counts across various water types. Your goal changes with context. Six is bad on a reservoir but maybe typical on a coldwater stream.
And then there’s the pressure signal. This is where rough fish and invasive species enter the picture. Suckers and carp aren’t bad necessarily. But they competes with native fish for food. They also stir up sediment that reduces water clarity and changes habitat. Eventually the community begin breaking down as the pressure becomes too great on its share. It lets you know when foundation is beginning to crack. This is easy to ignore at first if a few invasives show up, since they don’t seem to do much harm. But they add up. And by the time you realize your panfish are declining, it may be too late.
The last piece is recruitment, or does the future look bright? If there’s no young fish surviving to replace the old fish, then that’s a ticking clock (a failed year class). Is the age structure full of gaps or do you see good pulses of young fish? The calculator give each of these factors a score. Good recruitment indicates resilience; new fish are always coming into the mix, so habitat can withstand some level of stress. Poor recruitment means either the habitat limits or the spawning process need attention.
A good score doesn’t mean no action, it’s a screening test; it’s not a prescriptive diagnosis. You should still evaluate water quality, size distribution and age structure, but you have a baseline to help you tell the difference between normal changes and real issues. The fishery is not a static balance, though; it shifts with seasons and the weather. Your goal is to maintain that balance within bounds. Identify trends early by using tool, and address the habitat before the fish are telling you there’s an issue. That’s how you maintain pond health.