Seasonal Catch Comparison Calculator
Compare spring, summer, fall, and winter catch performance with standardized catch rate, biomass rate, rod-hour effort, temperature fit, and next-trip forecast.
📌Scenario presets
⚙Comparison settings
📊Season logs
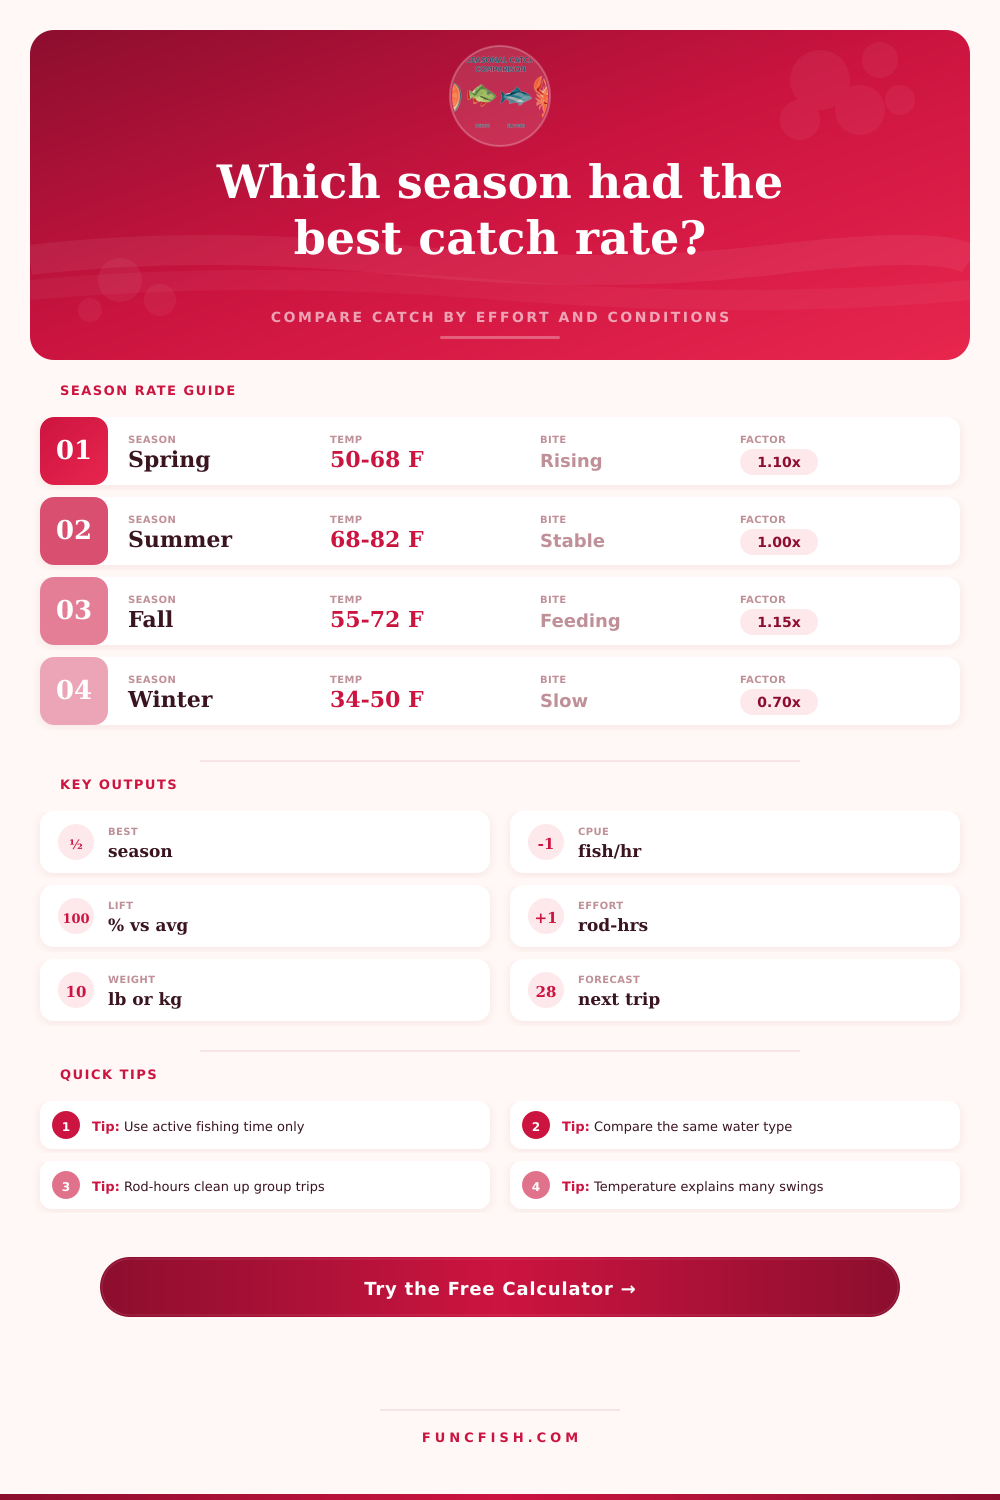
Spring
Summer
Fall
Winter
Seasonal comparison results
Full breakdown
📋Season and gear reference grid
Spring
Summer
Fall
Winter
📐Comparison tables
| Species group | Cool-water fit | Warm-water fit | Typical seasonal swing |
|---|---|---|---|
| Bass | Spring / fall | Summer structure | Medium to high |
| Trout | Spring / winter | Low at warm temps | High when water warms |
| Walleye | Spring / fall | Night or depth | Medium |
| Panfish | Spring schools | Summer docks | Medium |
| Catfish | Slow in cold water | Strong in warmth | High |
| Inshore mixed | Fall migration | Summer tide windows | Medium to high |
| Metric | Formula basis | Best use | Watch point |
|---|---|---|---|
| Trip CPUE | Fish / active hour | Solo logs | Breaks inflate rate |
| Angler CPUE | Fish / angler-hour | Group trips | Skill mix affects rate |
| Rod CPUE | Fish / rod-hour | Multi-line sets | Passive rods vary |
| Biomass CPUE | Weight / effort | Size comparison | One large fish can skew |
| Temperature fit | Distance from sweet band | Season context | Surface temp is only a proxy |
| Forecast range | Rate x next effort | Planning a repeat | Use comparable water |
💡Calculation checks
Effort check: Seasonal totals compare best when each season uses the same definition of active fishing time. Include only time when lines were fishing.
Temperature check: The temperature fit is a context adjustment, not a replacement for real catch data. A strong log can still beat the expected season curve.
Gear check: Use rod-hours for trolling, surf sets, bank rods, and other multi-line methods. Use angler-hours for active casting and fly fishing.
Sample check: Treat any season with only one short trip as tentative. More trips narrow the comparison and reduce one-day bias.
Fishing logs provides information regarding the fishing activity of anglers. However, fishing logs are only useful if anglers compare the fishing logs from different fishing seasons to one another. For instance, a single day of fishing can be productive in the fall.
However, that same day of fishing dont comprise a complete data set unless that fall fishing data can be compared to the winter fishing data. A mediocre fishing trip in the spring might not appear to be successful compared to other fishing seasons. However, that same mediocre spring fishing trip can be understood as part of the expected outcomes of the water temperatures during the spring and the amount of time that the fishing line are in the water during those trips.
Compare Fishing Logs Across Seasons
By comparing fishing trips from different seasons, anglers can understand which fishing conditions leads to better fishing trip outcomes compared to other fishing conditions. Another factor that can interfere with the fishing trip comparisons is the effort that each angler put in to each fishing trip. Anglers can put in different amounts of effort into different fishing trips.
For instance, fishing from a kayak might require less effort than trolling with four rods for long periods of time. However, each of these trips can still be reflected in the same fishing log. However, normalizing the fishing logs for the active fishing time, the number of anglers participating in the fishing trips, and the number of rods that is used during each fishing trip can make adjustments to for errors in fishing trip comparisons.
By making these adjustments and ensuring that each fishing trip have the same effort component to each trip, anglors can understand if each fishing season truly provided more successful fishing trips than others. Water temperatures has a major impact upon fishing activities. Water temperatures also have a major impact upon the number of fish that will bite on the bait that the anglers are casting.
The fishing log calculator is used to calculate the mathematical equations that determine how close each fishing season was to the ideal water temperature for the specific type of fish that is being targeted with the fishing trips. For instance, a water temperature of 58 degrees may be ideal for bass for a spring day. However, the same water temperature in the late fall might reveal that the bass are not actively feed at such temperatures.
In addition to water temperature, other factors impact the outcomes of fishing activities. For instance, finesse plastic bait may contact more fish per hour than heavy fishing bait such as a bottom fish rig. However, the bottom fishing bait might produce larger fish during fishing trips.
Therefore, adjusting the outcomes of each type of fishing bait can be made, and the adjustment to the calculation methods ensures that the outcomes of each fishing trip reflect the methods of fishing that each angler actualy performs during their trips. For instance, if an angler primarily trolls their fishing trips, the rod-hour basis for the fishing trips will be more important than angler-hours. However, if the angler primarily casts their fishing lines into the water, angler-hours will be more important than rod-hours.
The most important outcomes of the fishing log calculator are the adjusted catch rate and the lift of the adjusted rate above the four-season average. The adjusted catch rate allows anglers to understand the performance of each fishing season after adjusting for the main variables that impact fishing success. Additionally, the lift of the adjusted catch rate above the average of the four seasons indicates whether the performance of each fishing season was truly better than average.
For instance, a 15 percent lift above the average rate for the four fishing seasons is a notable outcome. However, a 3 percent lift may just be normal variation in the fishing outcomes. An understanding of how many fish were caught during each fishing season can help anglers to forecast the number of fish that might be caught on their next fishing trip.
For instance, if winter season has the highest adjusted catch rate compared to other fishing seasons, that same seasonal fishing profile can be applied to the anglers upcoming fishing efforts. However, because there are still other variables to each fishing trip, the range of possible outcomes for the angler is still relatively wide. Ensuring that the data samples used to calculate the fishing outcomes are large enough can prevent inaccurate fishing data from being displayed.
For instance, a short fishing trip in the winter will have a larger impact upon the fishing data than six fishing trips in the fall season. The confidence in the data that is published for each fishing season reflects the number of fishing trips during each season. By determining that the fishing log is not a definitive indication of the success of the anglors fishing skills, the angler can avoid making bad plans for their fishing trips for the following year.
The usefulness of fishing logs becomes apparent over the span of multiple seasons of logging fishing trips. Anglers can learn which water temperatures encourage fish to bite on fishing bait and which fishing gear works best for each individual angler. Additionally, anglors can learn if fall fishing performance is truly the best of the four seasons or if it is simply the result of the perceived success of that fishing season during a few standout years in the fishing log.
Thus, each fishing season after these variables have been established will have a greater understanding of the type of outcomes that can be expected from each anglers fishing efforts. Therefore, each anglers next fishing trip will not rely upon chance, but upon calculation of each variable that has been determined during previous fishing trips.