Fish Condition Trend Calculator
Compare current and previous fish measurements to estimate relative weight, Fulton condition factor, 30-day direction, and a practical condition class.
📌Condition trend presets
⚙Fish condition inputs
Fish condition trend estimate
Formula breakdown
📋Species comparison grid
Largemouth bass
Rainbow trout
Walleye
Channel catfish
Bluegill
Northern pike
Redfish
Common carp
📐Reference tables
| Species | Standard model used | Example length | Example standard weight | Condition use |
|---|---|---|---|---|
| Largemouth bass | Power curve from length in inches | 18 in / 45.7 cm | 3.55 lb / 1.61 kg | Wr around 95 to 110 is usually solid |
| Rainbow trout | Salmonid length-weight curve | 16 in / 40.6 cm | 1.86 lb / 0.84 kg | High condition often reflects cold water forage |
| Walleye | Coolwater predator curve | 22 in / 55.9 cm | 3.78 lb / 1.71 kg | Lean post-spawn fish can rebound by fall |
| Bluegill | Panfish curve with steep small-fish gain | 8 in / 20.3 cm | 0.40 lb / 0.18 kg | Low Wr can point to crowding or low forage |
| Relative weight | Plain meaning | Likely field signal | Trend reading | Follow-up interval |
|---|---|---|---|---|
| 115 and above | Very heavy for length | Full belly, strong shoulders, or pre-spawn mass | Watch for seasonal drop after spawn | 30 to 60 days |
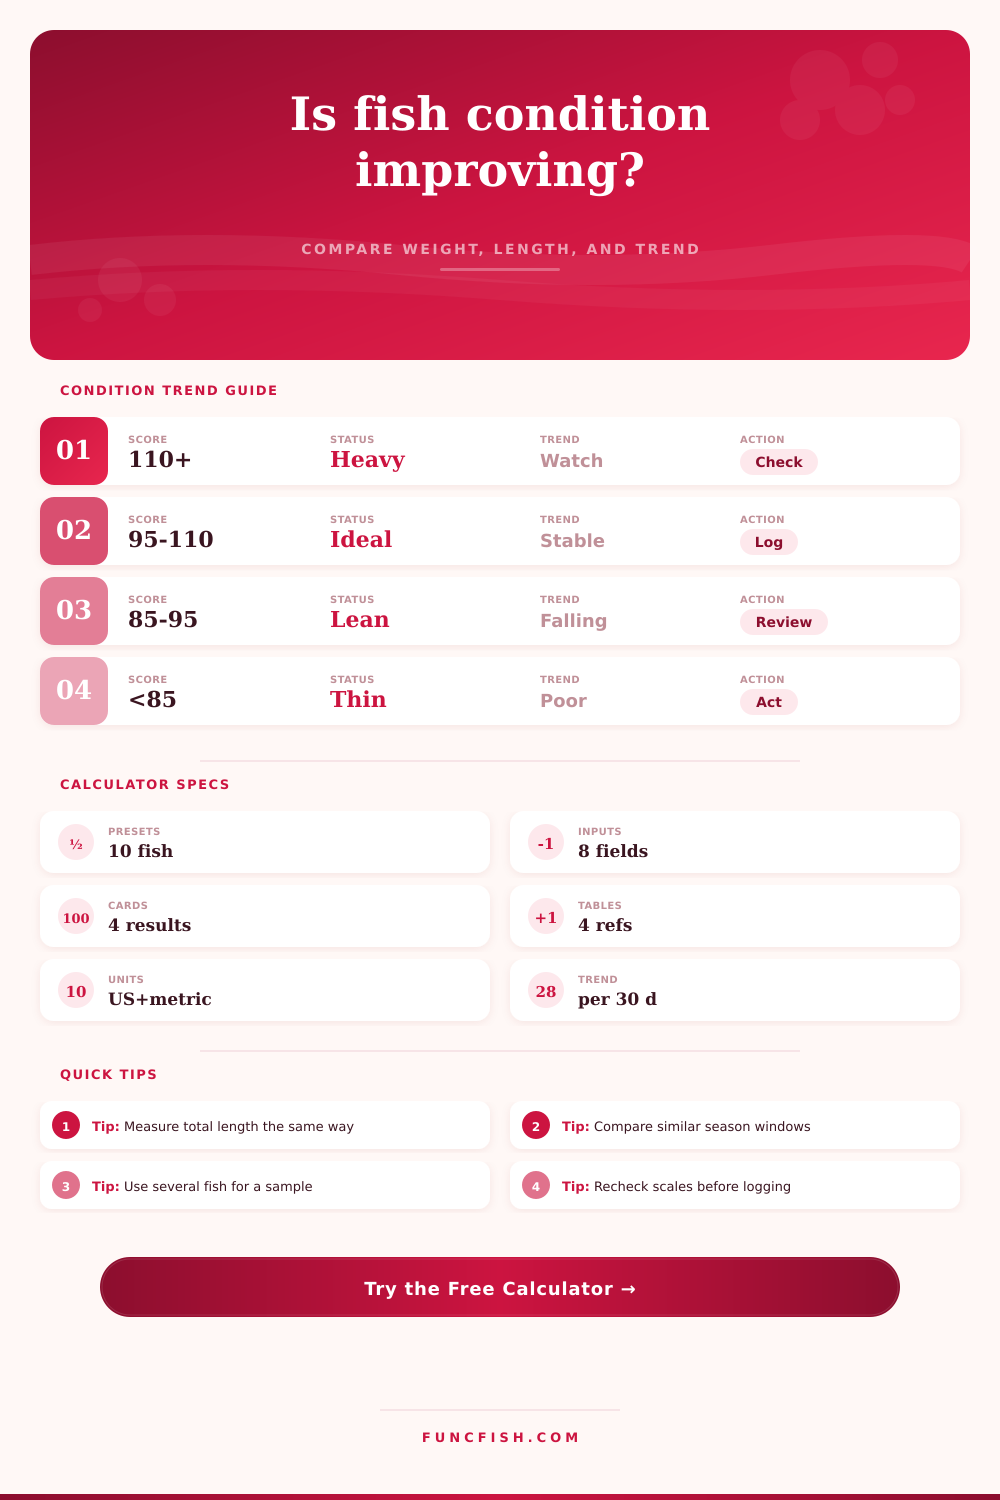
| 95 to 115 | Healthy target band | Good depth and weight for measured length | Stable or slightly rising is ideal | 45 to 90 days |
| 85 to 95 | Lean but recoverable | Thin belly, slower growth, or post-spawn fish | Rising trend is more important than one score | 30 to 45 days |
| Below 85 | Thin for length | Crowding, poor forage, stress, or sampling mismatch | Falling trend deserves prompt review | 14 to 30 days |
| Trend per 30 days | Condition direction | Best interpretation | Sampling caution | Useful comparison |
|---|---|---|---|---|
| +6 Wr or more | Improving fast | Forage intake is beating length growth | Confirm scale and length method | Same season sample |
| +2 to +6 Wr | Improving | Condition is moving in a good direction | Stronger when sample size is 6 plus | Similar size class |
| -2 to +2 Wr | Stable | No major condition movement detected | Single fish may mask group change | Median fish, not biggest fish |
| -6 Wr or lower | Declining | Weight is not keeping pace with length | Check season, spawn phase, and water stress | Forage survey or catch log |
| Measurement item | Preferred method | Common mistake | Effect on score | Field note |
|---|---|---|---|---|
| Total length | Closed mouth to compressed tail tip | Mixing fork length and total length | Can move Wr by many points | Use the same board each sample |
| Weight | Zeroed digital scale in calm conditions | Wet sling not tared or bouncing boat scale | Usually inflates or scatters Wr | Record to nearest practical increment |
| Time gap | Actual days between samples | Using calendar months loosely | Distorts 30-day trend speed | Keep capture dates with each entry |
| Sample group | Similar species and length class | Comparing mixed sizes or spawn phases | Trend may look false | Separate adult and juvenile groups |
💡Condition reading tips
Measurement tip: The length input has the biggest mathematical leverage because it is cubed in Fulton K and raised by the species curve in Wr. Use one length method every time.
Trend tip: A single low score after spawn or a hot-water period can be normal. A repeated negative 30-day trend across a similar size class is the stronger signal.
Some of you might have experienced where it’s a 3-pound fish on the scale, but it just doesn’t look like it has much meat on it for a three pounder. Then you slide the fish off the board and think that maybe water quality is poor or you just caught a skinny fish.
Taking one sample at a point in time won’t tell you as much as tracking condition over time will. One data point can skew results. A trend will show what change are happening with population health, seasonal stress, and food availability.
How to Measure Fish Health
The calculator do the math for you when you plug in weight and lengths, so you don’t have to visualize cubic relationships in your head. Wr stands for Relative Weight. In this case it’s weighing your fish by its actual weight against a set weight derived from species specific curves. So if you catch an eighteen-inch largemouth bass, according to biology, there is a certain weight it would of have to have to be average. Anything above that are considered plump. Anything below that is considered lean. Those numbers aren’t exact; they are just statistical averages.
What makes it interesting is that the type of water changes equation. Your fish will always be leaner in a low-nutrient, clear lake then it would be in a rich reservoir. This is why context matter. You’re comparing your number to what it should be based off where the fish was caught.
One older way to determine Fulton condition is using Fulton’s condition factor, which can used quickly in the field. It is simply weight-to-length-cubed ratio. Why do we cube the length? Because fish are measured in three dimensions and their volume increase by those three dimension. So if you have a 1 inch error in length, it will impact the condition more than even a small change in weight. This is where many folks gets tripped up. They try to be precise with their scales but don’t bother to compress tail correctly when they take a fish’s length on measuring board. Being precise on measurements matters less then how you take measurement every time. You want to make sure you’re consistent. Taking a length from the nose to the tail fork once and then taking another length all the way to the end of its tail won’t help you gather any useful trend data.
These scores are relative to season as well. During the spawn cycle, fish gets skinny. In fall when forage is plump and everywhere, fish will gain weight again. Lean fish in late spring could just be rebounding from the spawn, not an indicator of something wrong with system. By letting it know what time of year this reading occurred, you can normalize that factor so the test doesn’t judge it as harshly. Trout out of condition in warm water are cause for concern. Bass fresh off the spawn, not so much. Don’t let normal biological factors trigger panic.
Daily measurements is fine, but they’re difficult to interpret without looking back several days or weeks. That’s because growth doesn’t occur linearly. A fish may experience a feeding surge and grow rapidly, followed by a period where it stabilizes its weight. By looking at 30-day periods (or even better, adjusting your results to fit that timeframe), you can compare an individual’s rapid weight increase to a longer-term sample size.
The table below from the page gives you some idea of what a two or three point fluctuation means in terms of conditioning class changes. A shift of two or three points might just be noise. If there’s a consistent downward trend of six or more points, something’s likely wrong with either the water quality or the food source.
The numbers aren’t gospel. They’re guidelines that say ‘look harder’. If you have warm water and a declining trend, examine the dissolved oxygen. You should look for algae blooms. A rising trend means maybe your management efforts is succeeding. But it’s never about catching perfection, it’s always about getting in tune with the water.
Start with one fish, record result, wait for the pattern to reveal itself. Look at the pattern, not just a single moment. Follow the fish and they’ll share the story.