Fish Gonadosomatic Index Calculator
Estimate gonadosomatic index from fish body weight and gonad weight, compare the result with sex and species reference bands, and document sample confidence.
📌GSI presets
⚙Index inputs
Gonadosomatic index estimate
Calculation breakdown
🧪Field and lab checks
Whole wet mass used as the standard GSI denominator.
Corrected tissue mass after hydration or preservation adjustment.
Fulton K from body weight and total length.
Based on n, scale precision, correction size, and spread.
📊Reference tables
| Species profile | Typical female ripe GSI | Typical male ripe GSI | Index context |
|---|---|---|---|
| Largemouth bass | 4-12% | 1-4% | Spring values rise quickly before nest season. |
| Rainbow trout | 10-20% | 3-8% | Large ovary mass can dominate pre-spawn body weight. |
| Atlantic salmon | 8-18% | 3-9% | Running fish may lose somatic mass during migration. |
| Nile tilapia | 2-8% | 0.5-3% | Batch spawning creates mixed developing and ripe stages. |
| Channel catfish | 3-10% | 1-4% | Season and temperature strongly shape gonad development. |
| Common carp | 8-18% | 2-6% | Gravid females often produce high seasonal peaks. |
| Stage band | Female GSI guide | Male GSI guide | What the calculator reports |
|---|---|---|---|
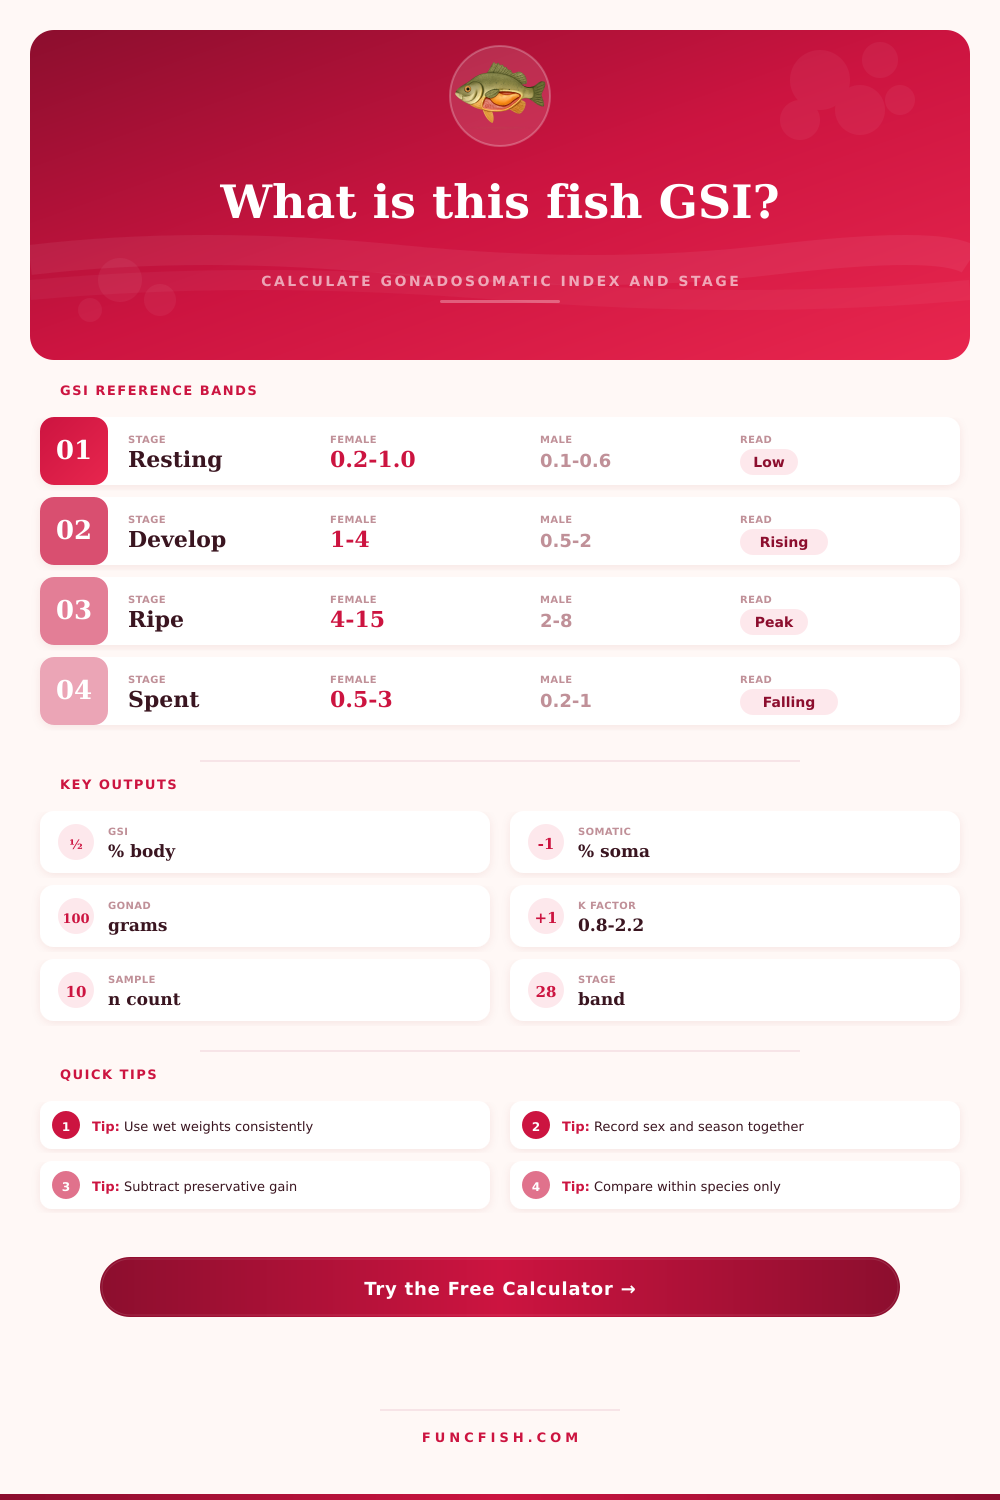
| Resting or immature | 0.2-1.0% | 0.1-0.6% | Low reproductive allocation; confirm with visual stage. |
| Developing | 1-4% | 0.5-2% | Gonads growing but usually not at peak mass. |
| Ripe or hydrated | 4-15%+ | 2-8%+ | High allocation; exact peak depends on species. |
| Spent or regressing | 0.5-3% | 0.2-1% | Falling values after spawning or partial release. |
| Mixed or unknown | Use group median | Use group median | Report sex ratio, season, and maturity notes beside GSI. |
| Correction setting | When to use it | Likely effect | Data note |
|---|---|---|---|
| Fresh wet weight | Immediate dissection and weighing | Baseline GSI | Best for comparing active reproductive state. |
| Blotted wet weight | Surface water removed before weighing | Slightly lower noise | Use the same blotting time for every fish. |
| Preserved tissue | Formalin or ethanol storage changed mass | Needs correction | Record preservative, duration, and correction percent. |
| Frozen-thawed | Stored samples before lab processing | Water loss possible | Keep thaw time and draining consistent. |
| Rapid field dissection | Boat, bank, or pond-side work | More scale noise | Choose a precision setting that matches the balance. |
| Measure | Metric basis | Imperial equivalent | Use in formula |
|---|---|---|---|
| Body weight | 1 g | 0.035274 oz | Denominator for standard GSI. |
| Gonad weight | 1 g | 0.035274 oz | Numerator after correction. |
| Total length | 1 cm | 0.3937 in | Condition factor and gonad mass per length. |
| Somatic mass | Body minus gonad | Same unit | Denominator for somatic GSI. |
| Condition K | 100 x g / cm cubed | converted first | Body condition context, not maturity by itself. |
📋Comparison grid
Most common index: corrected gonad mass divided by total body weight, then multiplied by 100.
Uses body mass after subtracting gonads, which can be clearer in very ripe females.
Corrected gonad grams per total length gives a size-normalized field check.
Fulton condition factor helps flag fish where low somatic mass inflates stage interpretation.
💡Practical GSI notes
It’s late in the day. The net feels like a ton. The water is cold. And there is a largemouth bass staring back at you that looks big.
Biology has some answers; your intuition fails here. Is it ready to breed? Resting up? Developing for another year? If only you knew.
How to Use the GSI Calculator
Enter the gonadosomatic index, a simple ratio comparing the fish’s weight with proportion dedicated to reproductive development. It doesn’t sound sexy, but it will help you determine whether to keep the fish or let a breeder go.
It does all the calculations for you. Simply enter weights into the calculator and it handles the unit conversions and correction factors for you. No more guesswork. Any biologist or angler can understand this simple concept. Take weight of the gonads. Divide that by body weight. Multiply by one hundred. That’s your percentage.
High=investment in sperm/eggs. A low percentage mean they are not investing energy in eggs or sperm. They invest energy in eating, swimming, and winter survival.
The key is knowing what you are measuring. Size isn’t always everything. The other thing most folks do wrong is not accounting for water content in their sample. Tissues from fish contain large amounts of water, and amount of water in the tissue will vary depending on how recently the fish was caught. Fresh wet weight would be the weight of the gonad when dissected and weighed at that time. Wait? Should I let it dry out? Should you put it into preservative? The weight will shift.
This tool provides a place where you can enter a percentage correction factor for shifting weight. A 10 percent correction factor could put you in an entirely different maturity stage. While it seems small, you should of thought about this when working through your process instead of just inputting a number. The hydration setting helps you to think through your process.
Another thing people tend to miss is that there are two types of GSI: somatic and standard. With standard GSI, it’s the entire body weight as your denominator. On the other hand, with somatic GSI, they’ll remove the gonad mass first, which means denominator is the actual flesh of the fish. That’s why this becomes more relevant when we’re talking about very ripe females whose gonads takes up a huge portion of their overall mass. The somatic index will provide a better look at the fish’s physical condition while removing reproductive burden. Both are provided by the calculator so you can see the numbers from two perspectives.
The condition factor is a supporting actor. This indicates how plump or thin the fish is for its size. So if you see a fish with a high GSI but a low condition factor it’s likely a thin spawner versus a robust spawner. Together, that shows the full picture. Are the fish in this lake healthy? Or are they stressed?
These numbers don’t lie, but they need a little context. Combine them with the season, the species profile, and the visual stages of the gonads. Then you’ll tell the whole story.
This also brings up one more important variable: Seasonality. The GSI for a bass might indicate it was at its prime when caught. In contrast, a trout’s GSI of five percent may reflect that he’s about midway through development if he was caught in late winter. To help guide those expectations there are reference bands built into the tool. These will give you an idea of where the majority of any given species should fall within the resting, developing, ripe and spent stages of their lifecycles.
Keep in mind these are all guidelines, not gospel. Every individual fish is different depending on their genetics. It also depends on available food and water temperatures. But it gives you a sense of what to expect and helps keep things sane. If you find yourself far off the mark of other species, chances are good you either misidentified the sex or weighed something incorrecty.
The key to using this well is thinking of it like a consistency engine. It is a reminder to capture all the variables that would affects your ratio. It prevents you from adjusting for one thing but not another or comparing summer samples to winter ones. This is really about creating a good set of data that helps you know what is going on in the water column. Then, by tracking those over time, you begin to understand their rhythm.
When do they wake up? When do they peak? How quickly do they crash? That’s where real management insight starts to happen. Math is just the key that opens that door.